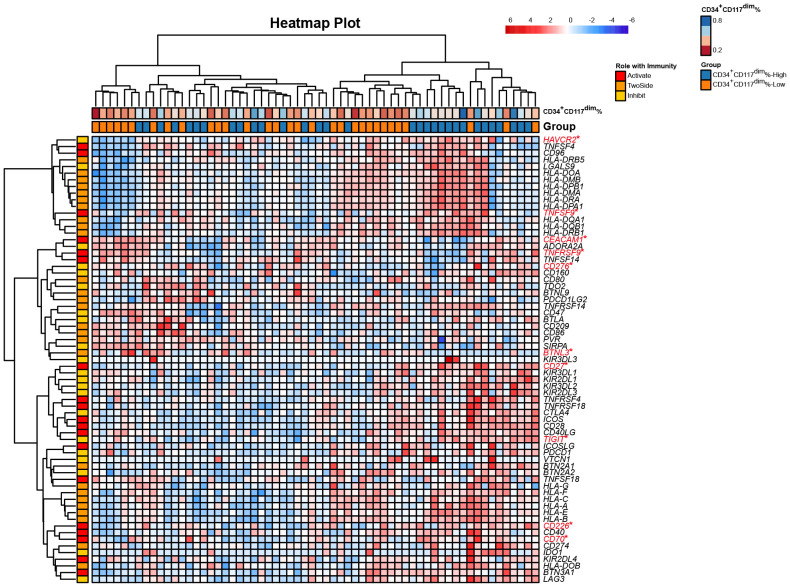
Figure 1.
Heatmap of the expression of 79 immune checkpoint genes from bulk RNA-seq of t(8;21) AML patients at diagnosis. Each column represents a sample, and each row represents an immune checkpoint gene. The 79 genes were characterized as having active, inhibitory and two-sided effects on the immune responses. The upper row shows the corresponding percentage of CD34+CD117dim cells in each sample detected via flow cytometry. The lower row shows the corresponding subgroup separated by the median CD34+CD117dim population, namely CD34+CD117dim%-High subgroup and CD34+CD117dim%-Low subgroup. *Denotes the differentially expressed genes between the two subgroups, namely CD34+CD117dim%-High subgroup and CD34+CD117dim%-Low subgroup. Statistical analyses were conducted with a two-sided Wilcoxon rank-sum test. *p < 0.05.

