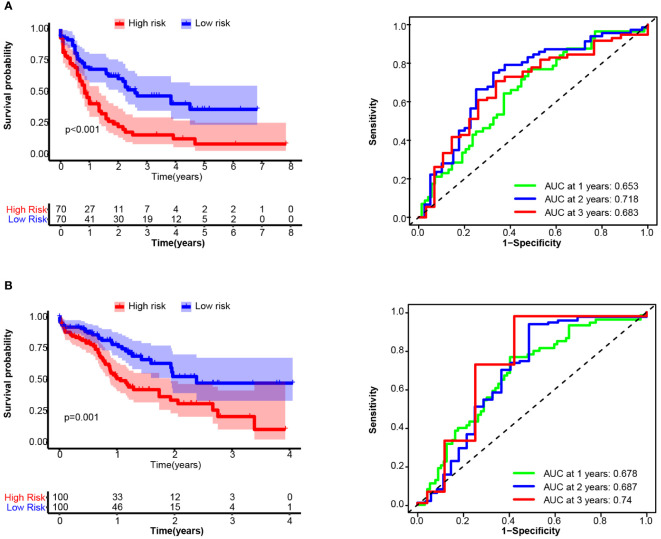
Figure 6.
Overall survival (OS) and receiver operating characteristic (ROC) curve analysis of the 14TGS model in TCGA_LAML (A) and validation cohort-4 (Beat AML, B) (Left panel) Kaplan-Meier curves and log-rank tests were used to estimate and compare the survival differences between the high- and low- risk subgroup. (Right panel) Specificity and sensitivity of the 14TGS model was calculated using the timeROC package and aera under (AUC) at 1-year, 2-year, 3-year were shown.

