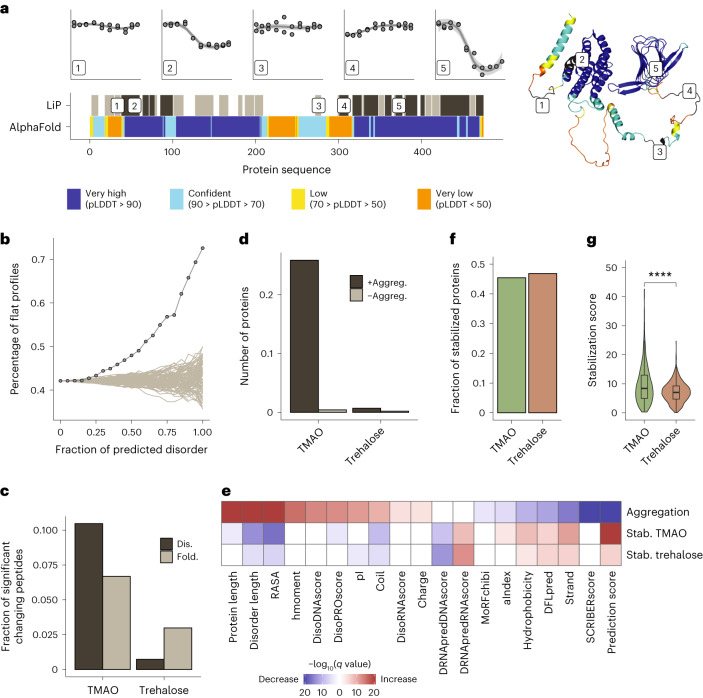
Fig. 6. Osmolyte effects on the human proteome.
a, Analysis of predicted disorder in regions of CAP-1 with different thermal melting behavior. Plots (top) show thermal profiles of five example peptides mapping to indicated regions along the protein sequence. The top barcode (LiP) shows all peptides (dark gray) with a measurable thermal melting profile out of all detected peptides (light gray) along the protein sequence. The lower barcode shows the AlphaFold pLDDT prediction score71; very low scores typically correspond to disordered protein regions. The AlphaFold-predicted structure is shown (right), with peptides annotated. b, Percentage of peptides with flat profiles (lines with dots) for proteins with increasing fractions of predicted disorder. All detected peptides/proteins are plotted. Gray lines show tests in which protein disorder was randomized. c, Fraction of peptides that show a structural change following osmolyte treatment relative to control out of all detected peptides calculated separately for peptides predicted to be folded (Fold) or disordered (Dis). d, Number of proteins with increased (+Aggreg.) or decreased (–Aggreg.) aggregation after the addition of osmolytes to HEK293T cell lysates at 37 °C. e, Biophysical features of human proteins affected by osmolytes. The heat map shows significantly enriched or depleted features for proteins that precipitate in the presence of TMAO versus those that do not precipitate (row 1, aggregation) or that are stabilized (Stab.) in the presence of the indicated osmolytes versus nonstabilized proteins (rows 2 and 3). P values were determined by two-sided t-tests followed by Benjamini–Hochberg multiple testing correction. hmoment, hydrophobic moment. f, Fraction of proteins stabilized in HEK293T cell lysates in the presence of TMAO and trehalose. g, Distribution of stabilization scores for proteins significantly stabilized by TMAO (899 proteins) and trehalose (948 proteins) based on two LiP–MS replicates per temperature. Horizontal lines indicate the median, boxes indicate the 25th and 75th percentiles, and whiskers indicate the maximum and minimum values. Significance was determined by two-sided Wilcoxon tests; ****P < 0.0001.

