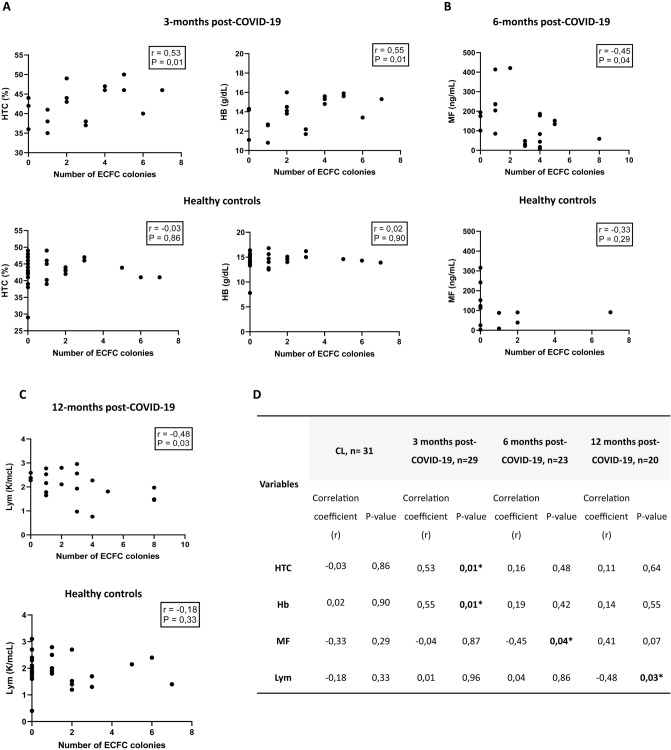
Fig. 2.
Relationship between number of ECFC colonies and clinical characteristics in COVID-19 patients and healthy controls. A Correlation between HTC and Hb and number of ECFC colonies at 3 months post-COVID-19 and healthy controls, Spearman rank correlation, *P < 0.05. B Correlation between MF levels and number of ECFC colonies at 6 months post-COVID-19 and healthy controls, Spearman rank correlation, *P < 0.05. C Correlation between lymphocytes levels and number of ECFC colonies at 12 months post-COVID-19 and healthy controls, Spearman rank correlation, *P < 0.05. D Correlation coefficients (r) and p-values for the relationship between the number of ECFC colonies and clinical characteristics in COVID-19 patients at 3, 6 and 12-months after infection and healthy controls. Spearman rank correlation, *P < 0.05. CL Healthy controls, ECFC endothelial colony-forming cells, HTC hematocrit, Hb hemoglobin, MF maximum ferritin

