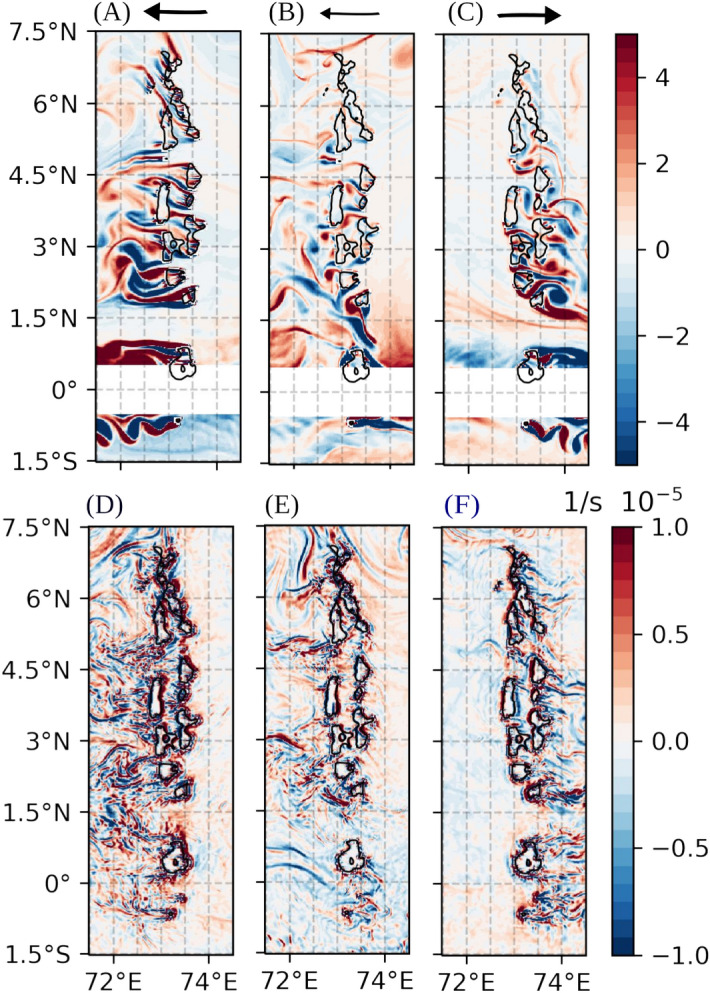
Figure 3.

(A–C): mid February (left), April (center) and June 2013 (right) instantaneous snapshots of surface relative vorticity normalized at each latitude by the Coriolis parameter to visualize the local Rossby number (the latitudinal band around the equator is removed). (D–F): corresponding instantaneous snapshots of lateral divergence at the ocean surface. The black line represents the 250 m bathymetry line. The arrow on top of the panels (A,B,C) represent the average direction of the surface currents. The thickness of the line it is an indication of their intensity.
