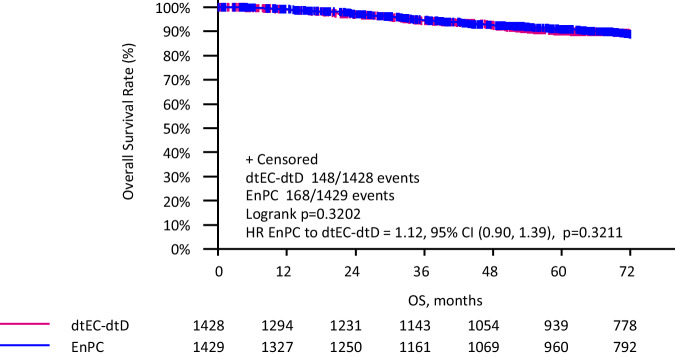
Fig. 2. Kaplan–Meier curves for overall survival in both treatment regimens (entire cohort).
Survival rates are shown over a 6-year period. The pink curve represents the dtEC-dtD cohort, and the blue curve represents the iddEnPC cohort. CI confidence interval, dtEC-dtD dose-dense, dose-tailored epirubicin/cyclophosphamide–dose-dense, dose-tailored docetaxel, iddEnPC intense dose-dense epirubicin, nab-paclitaxel, cyclophosphamide, HR hazard ratio.

