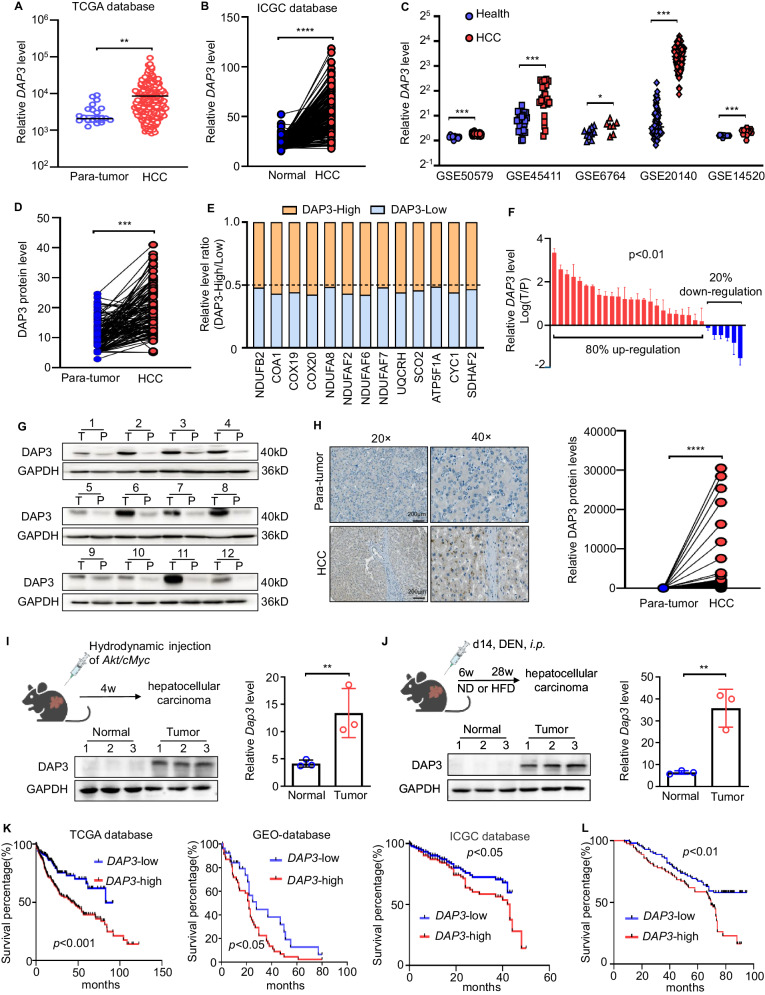
Fig. 1. Elevated DAP3 expression is correlated with shorter survival of HCC patients.
A The expression of the DAP3 mRNA in HCC and para-tumour liver samples was evaluated by analysing RNA-seq data from TCGA database. B Differential expression profiles of DAP3 in HCC and matched normal liver tissues from the ICGC cohort. C The DAP3 mRNA level in HCC samples was evaluated in several GEO datasets. D DAP3 protein expression in HCC and matched para-tumour tissues from the CPTAC database. E Analysis of the relationship of mitochondrial gene (NDUFB2, COA1, COX19, COX20, NDUFA8, NDUFAF2, NDUFAF6, NDUFAF7, UQCRH, SCO2, ATP5F1A, CYC1 and SDHAF2) expression with DAP3. Data were obtained from the TCGA-LIHC database. F qPCR was performed to measure the DAP3 mRNA level in 30 paired HCC tissues and para-tumour liver tissues. G Western blotting was used to measure the DAP3 protein level in HCC tissues and paired para-tumour liver tissues (n = 12). H Representative IHC images of DAP3 staining in human HCC tumour and para-tumour liver tissues. (Scale bar: 200 μm; magnification: 20× and 40×). Dot plots showed the comparison between para-tumour liver tissues and tumour tissues. The positive rate was measured using ImageJ software. ****p < 0.0001. I Orthotopic HCC models were established by a hydrodynamic injection of plasmids containing the Akt and cMyc genes with the SB100 transposase into C57BL/6 mice. The relative mRNA and protein expression levels of DAP3 were measured using qPCR and western blot analysis, respectively (representative of three independent experiments). J An HFD-induced model of HCC was induced by subcutaneously injecting 25 mg/kg DEN into mice on postnatal day 14, and HFD feeding commenced at 6 weeks of age. The relative mRNA and protein expression levels of DAP3 were measured using qPCR and western blot analysis, respectively (representative of three independent experiments). K Kaplan‒Meier analysis of the correlations between DAP3 expression and the survival rate of HCC patients based on an analysis of TCGA, GEO, and ICGC databases. L Kaplan‒Meier survival curves for HCC patients with high (n = 100) or low (n = 100) DAP3 expression. The cut-offs used for grouping were determined based on the median IHC score. Statistical analysis was performed using 2-tailed Student’s t test (Fig. 1A, B, C, D, F, H, I, and J) or the log-rank (Mantel‒Cox) test (Fig. 1K, L). The error bars indicate the means ± SDs. n.s., not significant; *p < 0.05; **p < 0.01; ***p < 0.001; and ****p < 0.0001.

