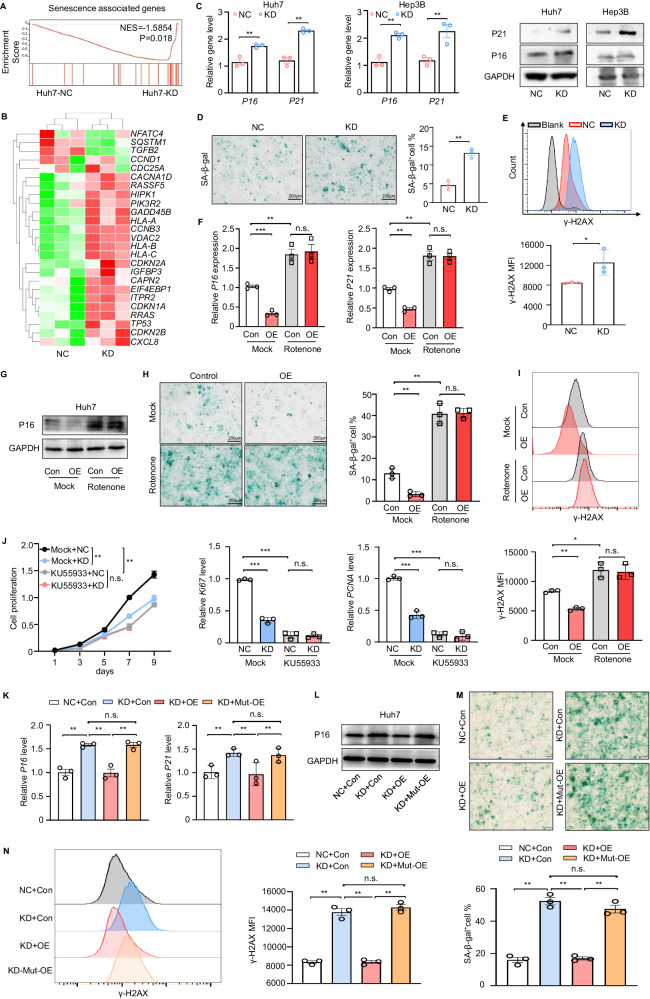
Fig. 6. DAP3185S is a key site for DAP3-mediated modulation of HCC cell senescence.
A GSEA plots of the ranked list of differentially expressed genes in the KD and NC groups were generated using the senescence-associated gene set. B Heatmap indicating specific senescence-related gene expression patterns in the DAP3 NC/KD groups. C–E Huh7/Hep3B cells with stable DAP3 knockdown (KD) and the corresponding negative control (NC) cells were used to evaluate indicators of cellular senescence. (C) qPCR and western blot analyses of senescence-associated gene and protein expression in DAP3-NC/KD HCC cells (representative of three independent experiments). D Representative images of senescence-associated β-galactosidase (SA-β-gal) staining in NC and DAP3-KD Huh7 cells. Scale bars, 200 μm (representative of three independent experiments). Blue indicates positive staining. E Flow cytometry analysis of the MFI of the DNA damage marker γ-H2AX in NC or DAP3-KD Huh7 cells (representative of three independent experiments). F–I Huh7 cells were transfected with the DAP3 overexpression vector or control vector for 48 hours and were then treated with 100 nM rotenone for 24 hours. F, G qPCR (F) and western blot (G) analyses of senescence-associated gene and protein expression in the indicated groups (representative of three independent experiments). H Representative images of SA-β-gal staining (scale bars, 200 μm). Blue indicates positive staining (representative of three independent experiments). I Flow cytometry analysis of the γ-H2AX MFI (representative of three independent experiments). J Huh7/Hep3B cells with stable DAP3 knockdown (KD) and the corresponding negative control (NC) Huh7 cells were treated with 10 mg/mL KU55933 for 12 h. CCK-8 assays were used to evaluate the proliferative capacity of Huh7 cells after the indicated treatments (representative of three independent experiments), and qPCR analysis of proliferation-related genes (KI67 and PCNA) was performed after the indicated treatments (representative of three independent experiments). K–N Huh7/Hep3B cells with stable DAP3 knockdown (KD) and the corresponding negative control (NC) Huh7 cells were transfected with the DAP3 overexpression vector (OE), DAP3S185A overexpression vector (Mut-OE) or control vector (Con) for 48 hours. K, L qPCR (K) and western blot (L) analyses of senescence-associated gene and protein (P16, P21) expression in the indicated groups (representative of three independent experiments). M Representative images of SA-β-gal staining. Scale bars, 200 μm. Blue indicates positive staining (representative of three independent experiments). N Flow cytometry analysis of the γ-H2AX MFI (representative of three independent experiments). Statistical analysis was performed using two-way ANOVA (Fig. 6J) or 2-tailed Student’s t test (Fig. 6C, D, E, F, H, I, J, K, M and N). The error bars indicate the means ± SDs. n.s., not significant; *p < 0.05; **p < 0.01; ***p < 0.001; and ****p < 0.0001.

