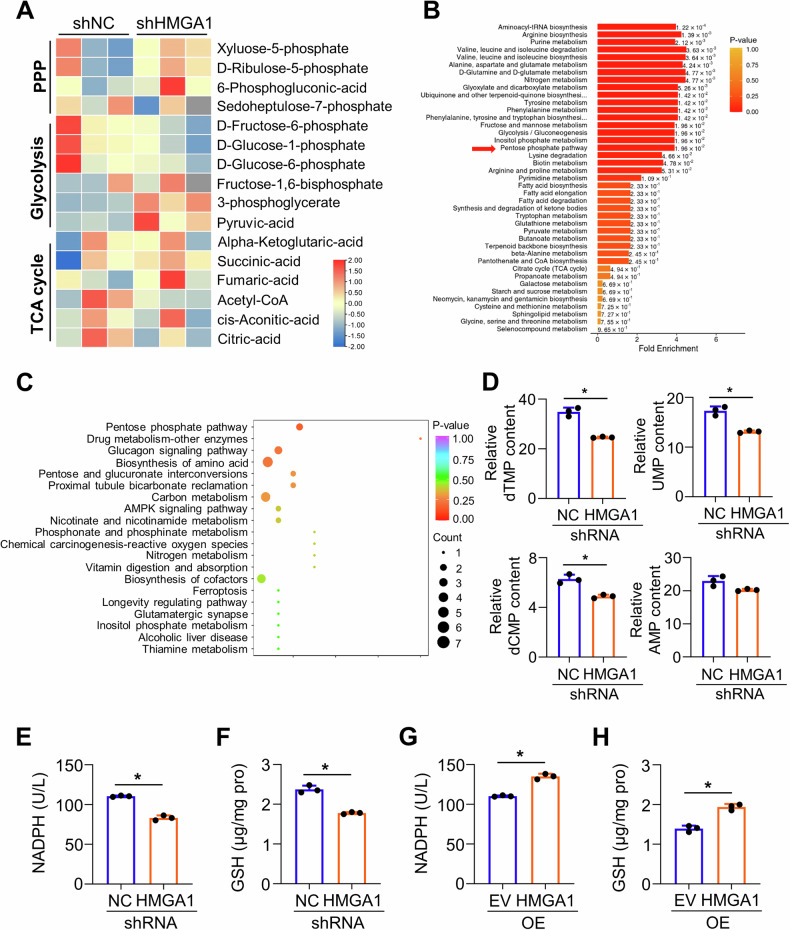
Fig. 3. HMGA1 upregulates pentose phosphate pathway.
A–D Targeted metabolomics was performed using Shimadzu LC Nexera X2 UHPLC coupled with a QTRAP 5500 LC MS/MS (AB Sciex). Chromatographic separation was performed with ACQUITY UPLC UPLC BEH Amide analytic column (Metware, Wuhan, China). A Heatmap of metabolites in glycolysis, PPP, TCA cycle from KYSE30-ctrl and KYSE30-shHMGA1 cells in the targeted metabolomics analysis. B Enrichment analysis of metabolites in KYSE30-ctrl and KYSE30-shHMGA1 cells. C The bubble plot of metabolite enrichment pathway. D Relative levels of nucleotide in KYSE30-ctrl and KYSE30-shHMGA1 cells in the targeted metabolomics analysis (n = 3). E, F Relative levels of NADPH (E) and GSH (F) in KYSE30 cells with HMGA1 knockdown. G, H Relative levels of NADPH (G) and GSH (H) in TE13 cells with HMGA1 overexpression. *P < 0.05, n = 3.

