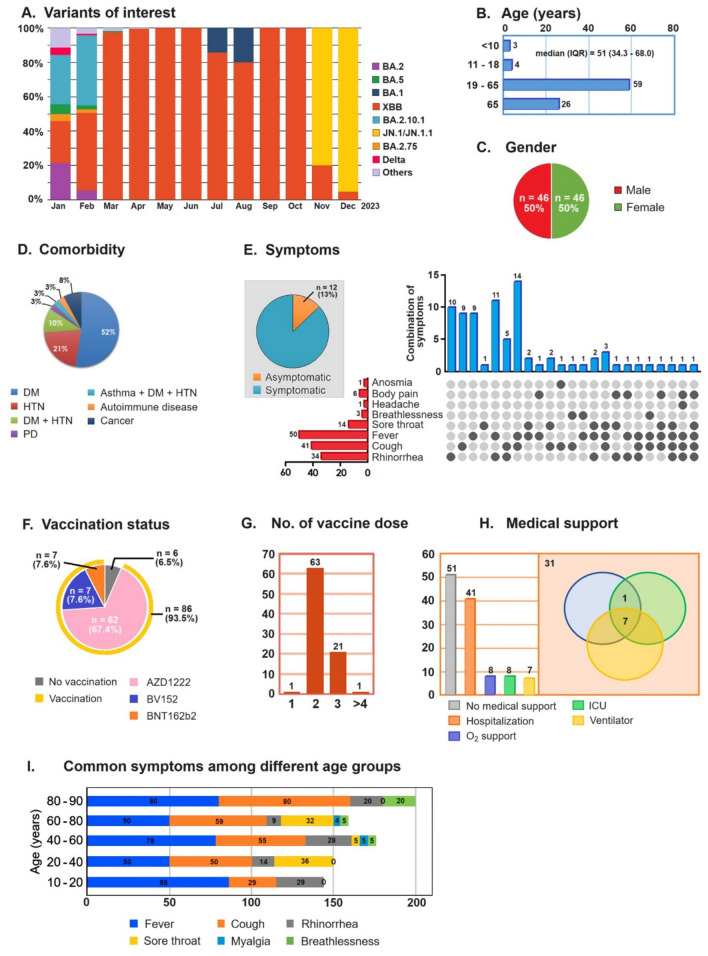
Figure 1.
Distribution dynamics and clinico-demographic characteristics of the study population. (A) Analysis of the proportions of different SARS-CoV-2 variants circulating in Tamil Nadu over time. The x-axis represents the timeline, the y-axis represents the proportion, and different colors represent distinct variants. (B)–(H) Clinico-demographic characteristics, where (B) median age, (C) gender, (D) symptoms, (E) comorbidity, (F) vaccination status, (G) number of doses received, (H) medical support, and (I) Common symptoms among different age groups. Note: All patients recovered from COVID-19.

