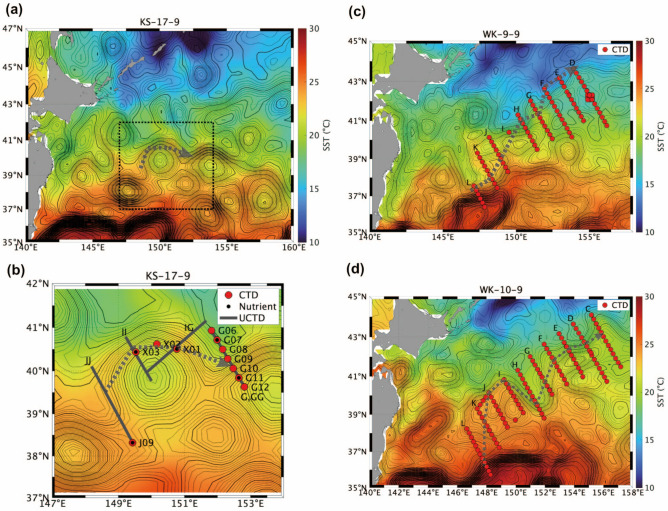
Figure 1.
SST (°C, color) and sea surface height (SSH, m, contour) during cruises in (a) 2017 (KS-17-9), (c) 2009 (WK-9-9), and (d) 2010 (WK-10-9). (b) Zoom of the box in (a). Contour intervals are 0.01 and 0.05 m for thin and thick lines, respectively. In each panel, locations of conductivity-temperature-depth (CTD) stations (red circles), bottle samples (black circles), and underway CTD (U-CTD) measurement lines (thick gray lines) are shown. Gray dotted lines illustrate the QSJ pathway.

