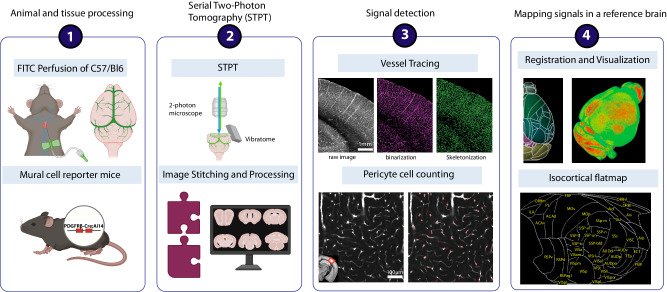
Fig. 1. STPT based vessel tracing and pericyte counting pipeline.
The steps of the STPT pipeline are outlined in order. 1. Brain sample collection: vascular filling procedure via cardiac perfusion with FITC conjugated albumin gel and pericyte mapping using PDGFRβ-Cre; Ai14 reporter mice. 2. STPT imaging: a combination of 2-photon microscope 2D tile imaging with serial vibratome sectioning to obtain cellular resolution images of the whole mouse brain. These image tiles are then stitched to reconstruct tissue sections spanning the olfactory bulb to the cerebellum. 3. Signal detection: vascular tracing with binarization of FITC-filled vascular signals and skeletonization and deep learning-based detection of capillary pericytes. 4. Mapping signals in a reference brain: All detected signals were registered to the Allen Common Coordinate Framework (Allen CCF) and an isocortical flatmap was used to examine signals in the isocortex.

