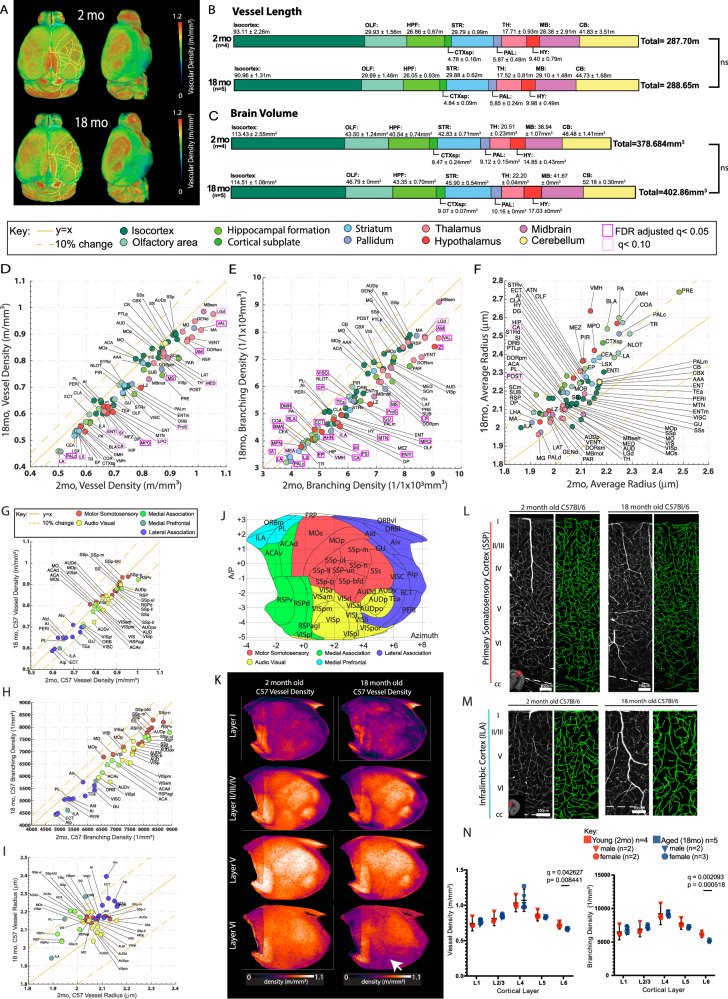
Fig. 2. Region specific reduction of vascular length and branching density and increased vascular radii.
A The averaged vasculature length density of 2-month-old (2mo, N = 4) and 18-month-old (18mo, n = 5) brains registered to the Allen CCF. B, C Summed vessel length (B) and brain volume (C) in 2-month-old and 18-month-old brains with the mean and SD provided for each anatomical region. D–F Scatter plots of averaged vascular length density (m/mm3) (D), vascular branching density (1/mm3) (F), and vascular radii (μm) between 2-month-old (x axis) and 18-month-old (y axis) brains across different brain regions. Areas that reach FDR adjusted q < 0.05 are outlined in magenta boxes. G–I Scatter plots of the isocortex data for averaged vascular length density (G), vascular branching density (H), vascular radii (I) between 2-month-old (x axis) and 18-month-old (y axis) brains. Isocortical areas are color coded based on grouping in (J). The solid yellow line represents y = x and the dotted line on either side represents a 10% difference from the solid yellow line. No areas show significant changes. J Isocortical flatmap with Allen CCF border lines and region-based color-coding. Y axis: Bregma anterior-posterior (A–P) coordinates, X axis: the azimuth coordinate represents the physical distance by tracing the cortical surface on the coronal cut. K Averaged vascular length density of different cortical layers in the flatmap between 2-month-old and 18-month-old brains. A white arrow highlights the significant decrease of vascular length density in the layer 6 cortical layers. L, M Representative example 250μm maximum intensity projection images of the primary somatosensory cortex (L) and the infralimbic cortex (M) with vascular tracing (green on the right side) between 2-month-old (n = 4) and 18-month-old brains (n = 5). Note the significant reduction of vasculature in the deep layer. N Both vascular length and branching density showed reductions in layer 6. Scale bars for L and M are 100 μm. For two group comparisons, two-sided unpaired t-tests (p-value) were used with multiple comparison correction (q values) to account for comparisons across multiple brain regions (B–I, N). Data are presented as mean values +/- SD for all graphs. Source data are provided as a Source Data file. Brain region abbreviations can be found in the Source Data File or Allen atlas at https://atlas.brain-map.org/atlas?atlas=602630314.

