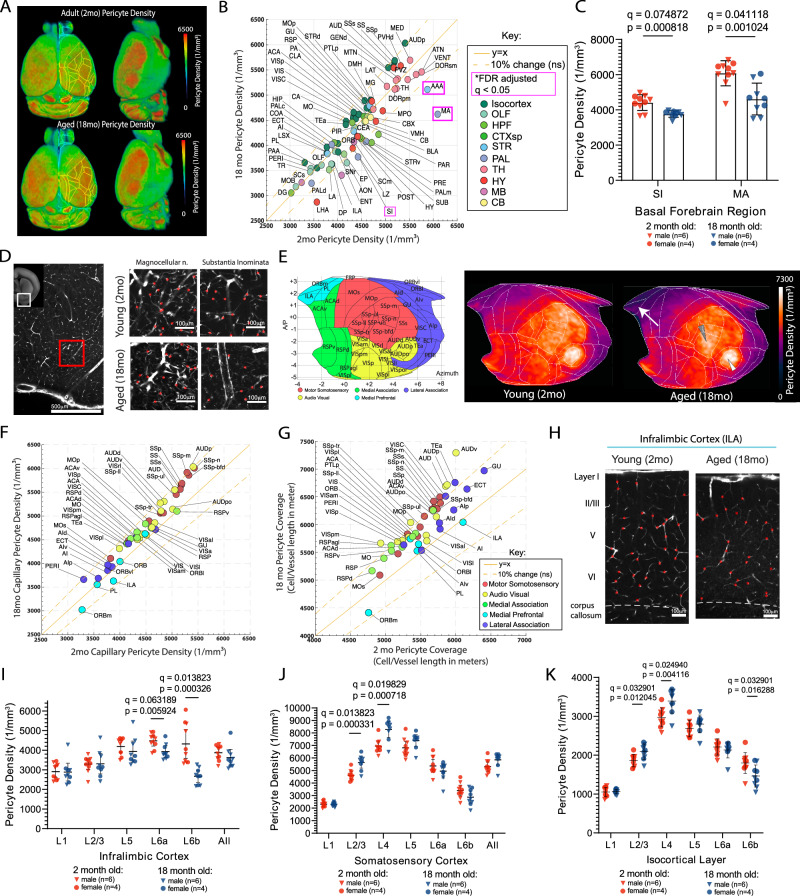
Fig. 3. Aged brain showed selective reduction of capillary pericytes in the basal forebrain area and the deep cortical layer.
A Averaged capillary pericyte density in 2-month-old (n = 10) and 18-month-old (n = 9) PDGFRβ-Cre;Ai14 mouse brains that are registered to the Allen CCF. B A scatter plot of capillary pericyte density between 2-month-old (x axis) and 18-month-old (y axis). Brain areas are color coded based on the Allen CCF ontology. Brain regions that are significantly different between groups, reflected by FDR adjusted q < 0.05, are outlined in magenta boxes. The solid yellow line represents the value for y = x and the yellow dotted lines on either side of the solid yellow line represent a 10% difference from the solid yellow line. C Bar graphs of capillary pericyte density in the substantia innominata and magnocellular nucleus between 2-month-old and 18-month-old brains. D Representative images of the basal forebrain, scale bar 500 μm(left) and higher resolution examples of the magnocellular nucleus and substantia innominata in 2-month-old and 18-month-old brains, scale bar 100 μm. Red dots represent detected pericyte cell bodies in each respective region. E The isocortical flatmap (left) and averaged capillary pericyte densities plotted in the flatmap from 2-month-old and 18-month-old brains. F, G Scatter plots of capillary pericyte density (F) and pericyte coverage (pericyte density per vascular length density; G) in isocortical areas. H Representative images of capillary pericyte density in the infralimbic cortex from 2-month-old and 18-month-old brains, scale bar 100 μm. I–K Layer specific capillary pericyte densities from the infralimbic cortex (I), the somatosensory cortex (J), and across all isocortical areas (K). Note the significant density reduction in the deep cortical layers. For two group comparisons, two-sided unpaired t-tests (p-value) were used with multiple comparison correction (q values) to account for comparisons across multiple brain regions (B, C, F, G, I–K). Data are presented as mean values +/- SD for all graphs. Source data are provided as a Source Data file.

