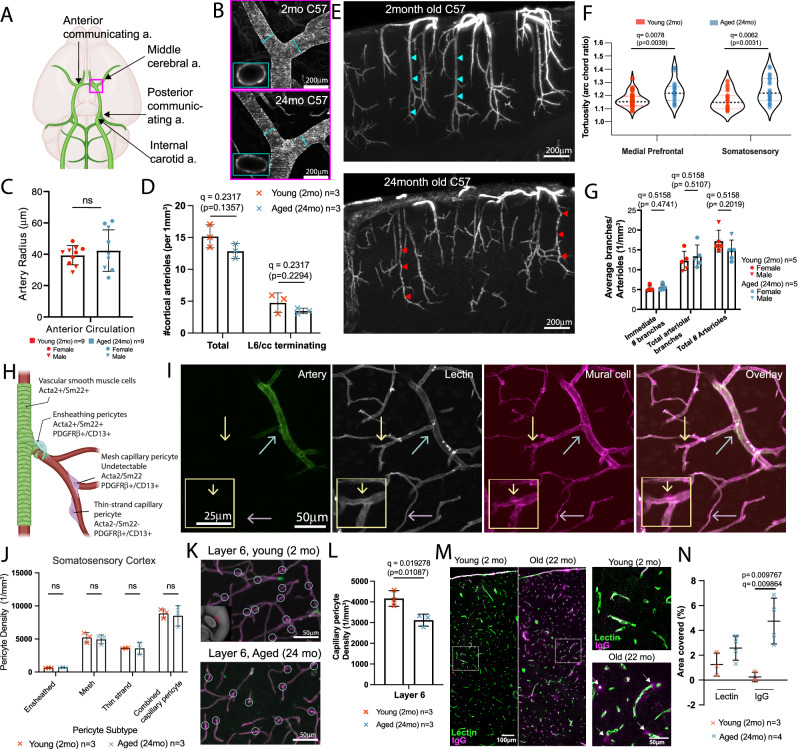
Fig. 5. Aging induces significant arteriole remodeling and selective pericyte density reduction.
A Schema of main arteries of the circle of Willis at the ventral surface of the brain. B Artery specific labeling of the middle cerebral artery branching area (red box area in H) from 2-month-old and 24-month-old brains, scale bar 200 μm. C Artery radii do not show a significant difference between the two age groups. D The number of both total and deep layer 6 reaching penetrating cortical arteriole did not show a significant difference between the two age groups. E Representative 600 μm MIPs of artery labeling in the somatosensory area of a young (top) and an aged (bottom) brain, scale bar 200 μm. Note tortuous arterioles in the old brain (red arrowheads) compared to straight ones in the young brain (light blue arrowheads). F Old brains showed significantly tortuous arterioles in the medial prefrontal and somatosensory cortices. Data from 3 animals for both young and aged groups. G Both immediate and total arteriole branch numbers show no significant differences between the two age groups. H Different pericyte subtypes with immuno markers and their position in the vascular order. I Submicron resolution LSFM images with artery labeling, whole vasculature labeled with lectin and mural cell labeling with PDGFRβ and CD13 antibodies. Scale bars of main images 50 μm and yellow outlined image 25 μm.The cyan arrow for an ensheathing pericyte, the yellow arrow for a mesh capillary pericyte, and the purple arrow for a thin-strand capillary pericyte. J Manual cell counting did not show any significant difference in the somatosensory cortex between the two age groups. K, L However, layer 6 of the somatosensory cortex (K) showed a significant reduction in pericyte density (L), scale bar 50 μm. M, N Increased IgG extravasation in 22-month-old brain compared to 2-month-old brain, scale bars of main images are 100 μm, and higher magnification images are 50 μm (M) and quantification (N). For two group comparisons, two-sided unpaired t-tests were used with multiple comparison correction to account for comparisons across multiple brain regions. For multiple comparisons two-way ANOVA, or mixed model if including NaN values, to generate comparison between groups. All q values obtained from multiple comparison correction by false discovery rate and uncorrected p-value are reported in each graph, except (F) with Bonferroni correction. Data are presented as mean values +/- SD in all graphs. Source data are provided as a Source Data file.

