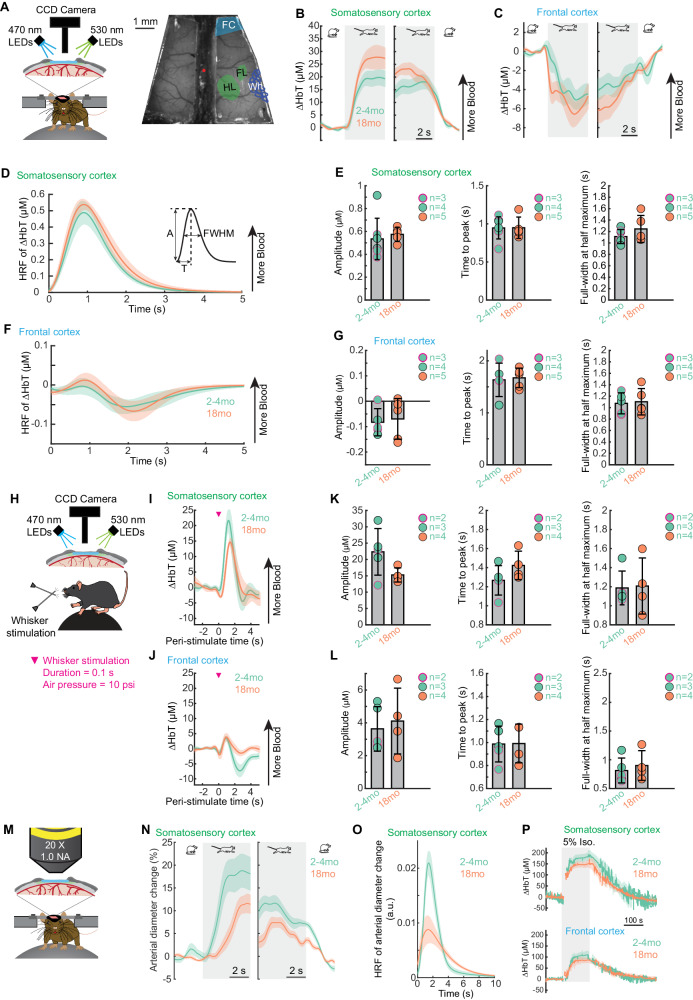
Fig. 6. Cortical hemodynamic responses to voluntary locomotion and whisker stimulation is intact in normal aging.
A Left, schematic of the experimental setup for IOS imaging during voluntary locomotion. Right, an image of thin-skull window and overlay of corresponding anatomical reconstruction; scale bar = 1 mm. FC, frontal cortex; FL/HL, forelimb/hindlimb representation of the somatosensory cortex; Wh, vibrissae cortex. B Population average of locomotion onset (left) and offset (right) triggered average of ∆HbT responses in FL/HL across different age groups. C As in (B) but for FC. Sample sizes for A-C include: 2-4 month old mice: n = 7 (4 males and 3 females) and 18 month old mice: n = 5 (all males). D Hemodynamic response function (HRF) of ∆HbT in the FL/HL across different age groups. E Quantification of HRF of ∆HbT in the FL/HL: amplitude (A, left), time to peak (T, middle), and full-width at half maximum (FWHM, right), for 2-4 month old: n = 7 mice (4 males and 3 females) and 18 month old mice: n = 4 (all male mice). Sex is shown with a black circle outline for males and a magenta circle outline for female mice. F As in (D) but for FC. G As in (E) but for FC. H Schematic of the experimental setup for IOS imaging during whisker stimulation. I Average population responses of ∆HbT to contralateral whisker stimulation in the FL/HL across different age groups. J Quantification of the whisker stimulation evoked responses of ∆HbT in the FL/HL: amplitude (left), time to peak (middle) and full-width at half maximum (right), for 2-4 month old: n = 5 mice (3 males and 2 females) and 18 month old mice: n = 4 (all male mice). Sex is shown with a black circle outline for males and a magenta circle outline for female mice. K As in (I) but for FC. L As in (J) but for FC. M Schematic of the experimental setup for 2PLSM imaging during locomotion. N Population average of locomotion onset (left) and offset (right) triggered the average of arteriole diameter responses in FL/HL across different age groups. O Hemodynamic response function (HRF) of arteriole diameter changes in the FL/HL across different age groups. P Population average of ∆HbT responses to inhalation of 5% isoflurane in the FL/HL (top) and FC (bottom) across different age groups. Sample sizes for M-P include 2-4 month-old: n = 4 (all male mice) and 18-month-old: n = 4 (all male mice). Solid lines and shaded areas in (B, C, D, F, I, N, O, P) denote mean ± SEM, respectively. Data are shown as mean ± SD in all other graphs (E, G, J, L). Source data are provided as a Source Data file.

