
Fig. 1. A schematic representation of the minimal model of coupled Aβ aggregation and inflammation used in this study.
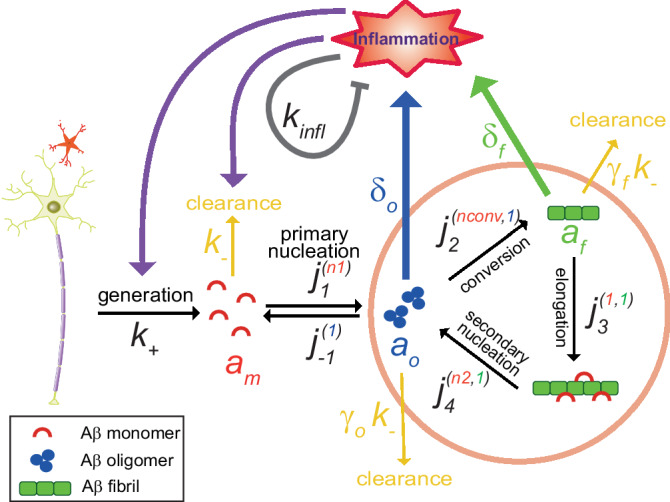
The following events (and related parameters) are shown: (i) generation of Aβ monomers by neurons and astrocytes (rate, ), (ii) clearance (degradation) of Aβ (rate constant for Aβ monomers, , scaled down by factors for oligomers and for fibrils), (iii) primary nucleation (forward rate constant, , with the superscript representing the molecular order with respect to Aβ monomers; reverse rate constant, , with superscript representing the molecular order of 1 with respect to Aβ oligomers), (iv) oligomer conversion (rate constant, , with the superscripts and 1 representing molecular orders with respect to Aβ monomers and oligomers, respectively), (v) elongation (rate constant, , with the superscripts 1 and 1 representing molecular orders with respect to Aβ monomers and fibrils, respectively), (vi) secondary nucleation (rate constant, , with the superscripts and 1 representing molecular orders with respect to Aβ monomers and fibrils, respectively), (vii) generation of inflammation by Aβ oligomers and fibrils (governed by the weight factors and , respectively), (viii) modulation of rates of Aβ generation and clearance by inflammation, and (ix) self-inhibitory mechanisms of inflammation (represented by ).