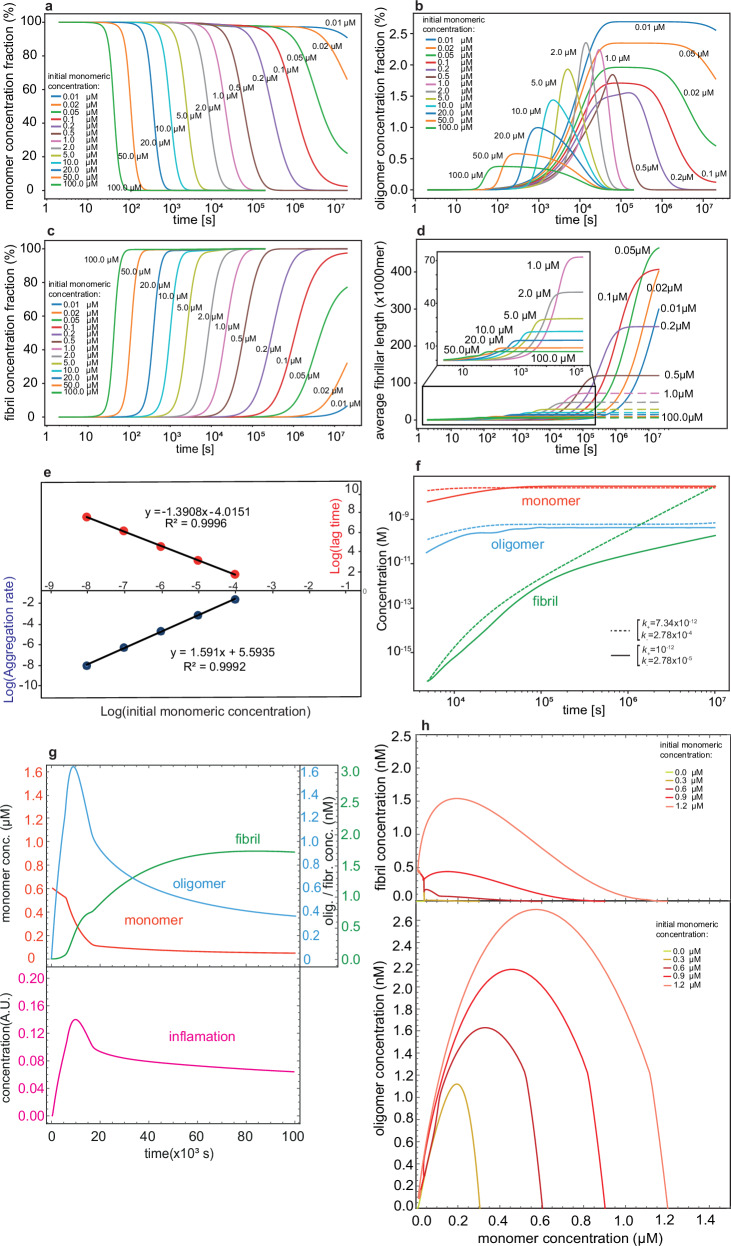
Fig. 2. Simulated kinetics of Aβ aggregation.
a–d Time-dependent changes in concentration of Aβ monomers (a), oligomers (b), and fibrils (c) in the closed model, i.e., with no generation and no clearance of Aβ and no inflammation or coupling with it, shown for initial Aβ monomer concentration varying from 0.01 μM to 100 μM. In d, the time-dependent changes in the average fibrillar length are demonstrated. e The log–log plots of aggregation rate and lag time vs initial Aβ monomer concentration yield apparent molecular orders (exponents) in close agreement with previous reports. f Time-dependent changes in concentration of Aβ monomers, oligomers, and fibrils in the open model, i.e., with generation and clearance of Aβ switched on but no inflammation or coupling with it allowed. The system approaches physiologically reasonable steady-state levels for Aβ monomers and oligomers, while gradual slight accumulation of Aβ fibrils is observed. With the two sets of generation () and clearance () rates used, no significant change was observed in the steady-state concentration of Aβ monomers and oligomers. g Time-dependent changes in concentration of Aβ monomers, oligomers, and fibrils (top panel) and inflammation level (bottom panel) in the open coupled model, i.e., an open model in which induction of inflammation and coupling between Aβ generation/clearance and inflammation are allowed. The example shown here is calculated for the initial Aβ monomer concentration of 0.6 μM. h Two-dimensional phase planes showing Aβ fibril (top panel) or oligomer (bottom panel) vs Aβ monomer concentration changes in the open coupled model with initial Aβ monomer concentrations of 0–1.2 μM. Despite different initial states, the trajectories converge to a fixed steady-state point.

