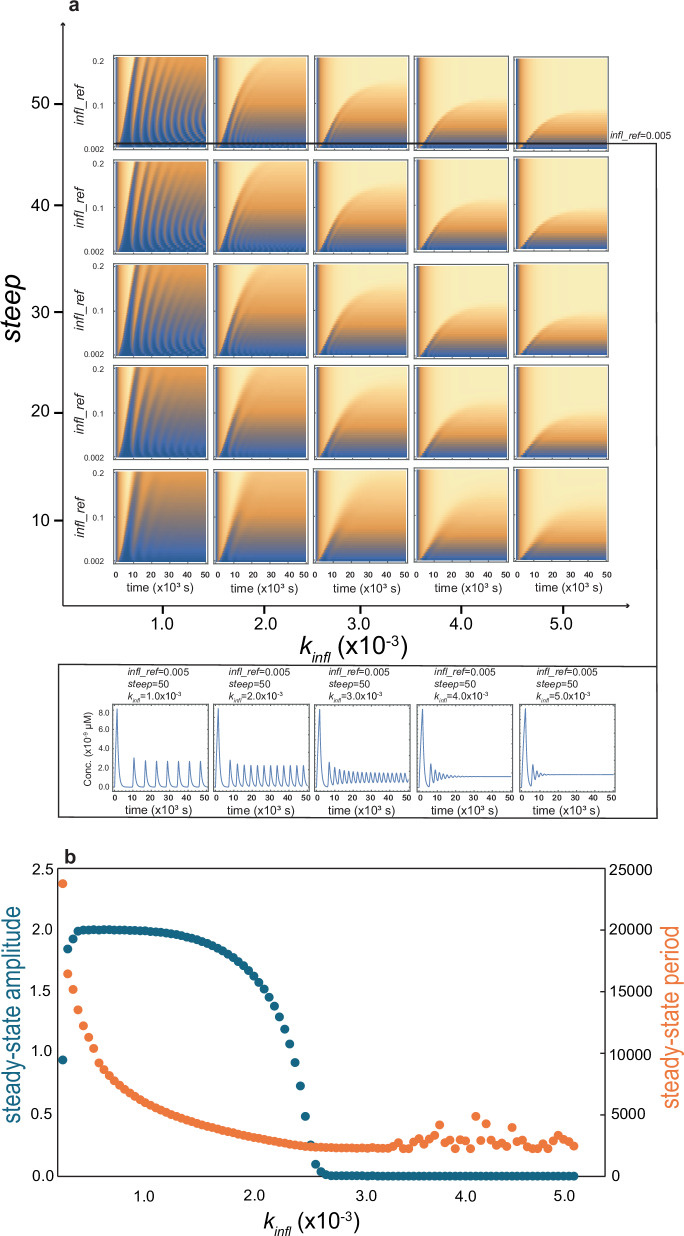
Fig. 3. Bifurcation analysis for the coupled Aβ aggregation-inflammation with respect to inflammation- and coupling-related parameters.
a Contour maps representing temporal changes in Aβ monomer concentration in dependence on three parameters: (outer x-axis), (outer y-axis), and (inner y-axis). Changes in these three parameters lead to distinct kinetic behaviors. As an example, a slice of contour maps at and , demonstrates how changes in the parameter affects oscillatory changes in Aβ monomer concentration (bottom of the panel). b Changes in the steady-state (relative) amplitude (primary axis, blue) and period (secondary axis, orange) of oscillations caused by variation in parameter (at and ). When increases, a transition from large-amplitude slow oscillation to small-amplitude fast oscillation is observed. Oscillations with very small amplitudes represent damped oscillations, in which the calculated spacing between peaks (period) can frequently become irregular and unreliable.

