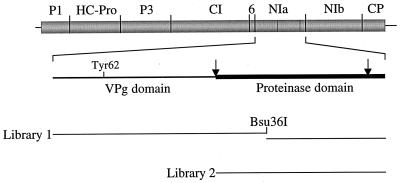
FIG. 1.
Maps of the TEV genome, NIa, and sequences subjected to random mutagenesis. The TEV genome is represented at the top, with the polyprotein coding region indicated in grey. The names of several individual TEV proteins are given above the map. The sequences coding for cleavage sites are shown as short vertical lines within the coding region. The NIa sequence is represented in the expanded diagram, with the N-terminal VPg and C-terminal proteinase (thick line) domains indicated. Arrows indicate positions of suboptimal internal cleavage sites within NIa. The VPg attachment site (Tyr62) is indicated. The sequences independently mutagenized in the two libraries are shown at the bottom. Library 1 was composed of two sublibraries as represented by the two offset horizontal lines.

