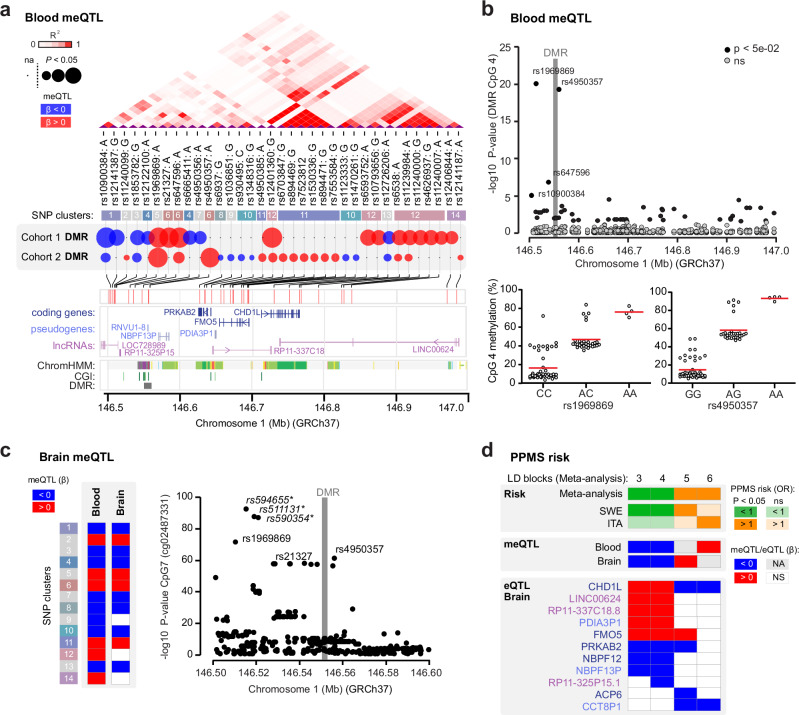
Fig. 3. Genetic control of methylation and gene expression in the 1q21.1 locus.
a Genomic and functional annotation of the methylation-controlling SNPs. Linkage disequilibrium (LD) is indicated by shades of red and clustering of SNPs is based on high LD between SNPs (R2 > 0.8). Colored circles show SNP effects on DMR methylation: size positively correlates with significance (–log10 P-value) and blue and red colors represent negative and positive effects of the minor allele, respectively. Gene location and regulatory features, i.e. CpG island (CGI) and chromatin state segmentation (ChromHMM), from ENCODE/Broad. b Association between genetic variation at the extended locus (upper panel) and DNA methylation in blood at CpG 4 of the 1q21.1 DMR, obtained using meQTL analysis in cohort 2 (n = 82). Significance is represented as –log10 (P-value). Association of the two strongest variants rs1969869 and rs4950357 with CpG 4 (as an example, lower panel). CpG codes are presented in Fig. 2c. c Effects of SNPs within each SNP cluster on DNA methylation at 1q21.1 DMR in the brain (using xQTL serve platform15) with only significant associations displayed in colors, blue and red colors representing negative and positive effect of the minor allele, respectively (left panel) and association between genetic variation in the extended locus and DNA methylation at cg02487331 (CpG 7) (right panel). Significance is represented as –log10 (P-value). * Indicates strong LD with rs21327 (R2 > 0.7). d. Association between genetic variation, DNA methylation (using xQTL serve platform15), and gene expression (using GTEx database) in the extended locus for SNPs tagging four variants (LD blocks) displaying significant association with PPMS in the meta-analysis of Swedish (SWE) and Italian (ITA) cohorts. Green and orange colors reflect protective and risk effects on PPMS risk conferred by the genetic variants, respectively. Blue and red colors represent the negative and positive effects of the minor allele, respectively, on methylation or expression. NA not available, NS not significant. The data shown in this panel are available in Supplementary Data 7 (meQTL, eQTL) and 8 (genetic analysis). A linear regression model with a Bonferroni-corrected or FDR-adjusted threshold of 0.05 was used for all the statistical tests.

