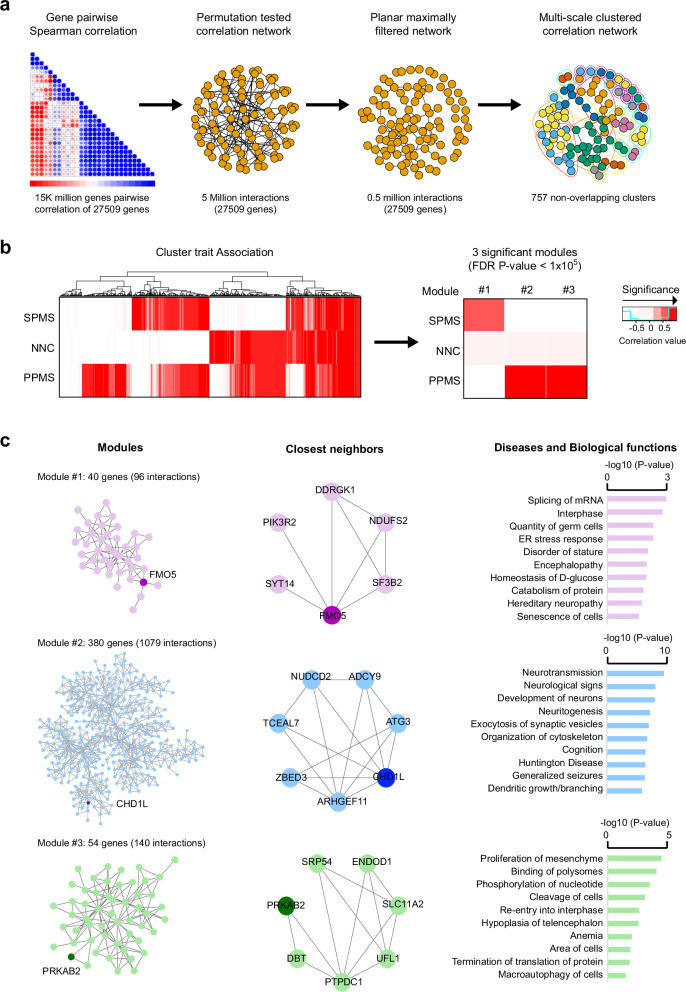
Fig. 5. Implication of CHD1L and PRKAB2 genes in PPMS brain pathology.
a Schematic representation of the correlation network analysis using bulk MS brain transcriptome9. The different steps are depicted from left to right: correlation matrix containing gene-gene pairwise Spearman correlations; illustration of the permutation test filtered correlation network surviving an FDR P-value < 0.05 and the planar maximally filtering to convert the scale-free network to be able to overlay on a plane spherical surface, reducing the network to 0.5 million interactions among 27,509 genes and, finally; representation of the multiscale clustering of the network resulting into 757 non-overlapping clusters. b Heatmap of the correlation coefficients of all 757 non-overlapping modules (left) and the three modules surviving correlation FDR P-value < 0.05 (right) to each tested phenotypic trait (nPPMS = 5, nSPMS = 7 and nnon-neurological controls = 10), with red gradient colors representing negative (not significant) to positive (significant) correlation. Spearman correlation is applied on every gene pair and P-values were adjusted for multiple comparisons by FDR ( < 0.05). c Representation of the three modules (left), the closest neighbors to candidate genes in each module (middle), and Gene Ontology findings, i.e. Disease and Biological functions, obtained using Ingenuity Pathway Analysis (Fisher’s exact test, P-value < 0.05). MS multiple sclerosis, PPMS primary progressive MS, SPMS secondary progressive MS, NNC non-neurological controls.

