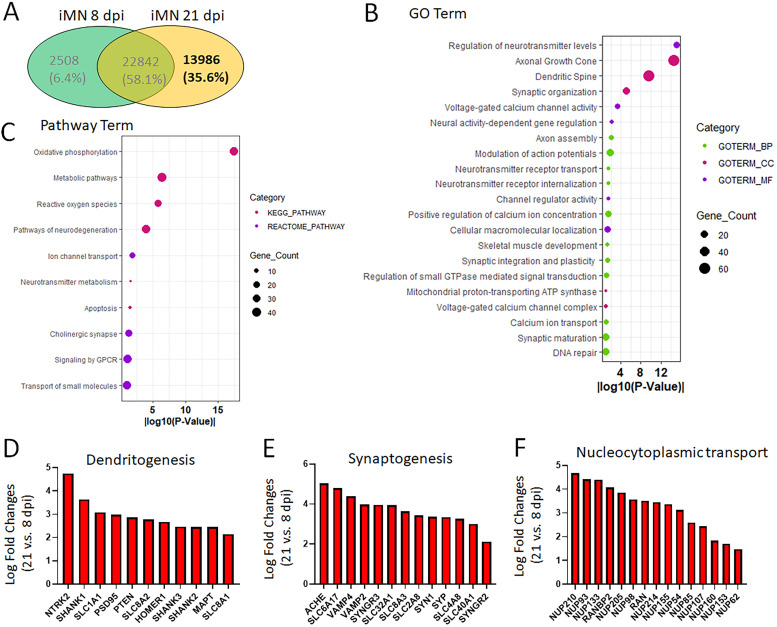
Figure 5.
Characterization of gene expression in hiPSC-MNs at late mature stages. A, Venn diagram shows the RNAseq results of the number of genes that were only identified in late-stage iPSC-MNs at 21 dpi prepared with culture inserts. B, GO analysis of genes only expressed in iPSC-MNs at 21 dpi with the enrichment of terms related to neuron functions. C, Pathway enrichment analysis with KEGG and Reactome of genes only expressed in iPSC-MNs at 21 dpi. D, Representative genes involved in dendritogenesis are upregulated in iPSC-MNs at 21 dpi. E, Representative genes involved in synaptogenesis are upregulated in iPSC-MNs at 21 dpi. F, Representative genes involved in nucleocytoplasmic transport are upregulated in iPSC-MNs at 21 dpi.

