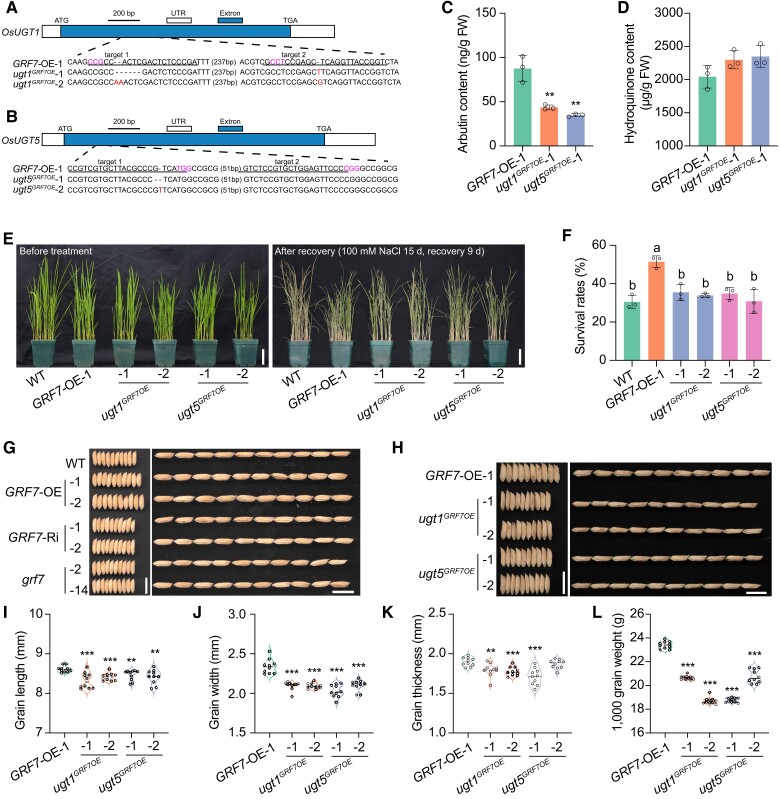
Figure 5.
OsUGT1 and OsUGT5 positively participate in the rice salinity stress response and grain size development. A) and B) CRISPR/Cas9-mediated target mutagenesis of OsUGT1A) and OsUGT5B) in the GRF7-OE background. The exons and UTRs (untranslated region) are represented by blue and white boxes, respectively. Each alignment between GRF7-OE-1 and mutated sequences containing the target sites is shown below the schematic. The red font is the mutant sequence and the purple font is the NGG site. Bar = 200 bp. C) and D) The in vivo contents of arbutin C) and hydroquinone D) in GRF7-OE-1, ugt1GRF7OE, and ugt5GRF7OE seedlings. Values are means ± SDs of 3 biological replicates. E) Phenotypes of WT, GRF7-OE-1, ugt1GRF7OE, and ugt5GRF7OE plants before salt treatment and after recovery. Bars = 5 cm. F) Survival rates of WT, GRF7-OE-1, ugt1GRF7OE, and ugt5GRF7OE plants after recovery. Values are means ± SDs with 3 biological replicates. Different letters represent significant differences at P < 0.05 determined by Tukey's multiple comparisons test. G) Grain morphology of WT and OsGRF7 transgenic lines. Bars = 1 cm. H) Grain morphology of GRF7-OE-1, ugt1GRF7OE, and ugt5GRF7OE plants. Bars = 1 cm. I) to L) Statistical analysis of the grain length I), grain width J), grain thickness K), and 1,000-grain weight L). Values are means ± SDs (n = 10 independent grains). WT, wild type. GRF7-OE, OsGRF7 overexpression lines. ugt1GRF7OE, OsUGT1 knockout lines. ugt5GRF7OE, OsUGT5 knockout lines. FW, fresh weight. For this figure, asterisks indicate significant differences by a two-tailed Student's t-test (**P < 0.01 and ***P < 0.001).

