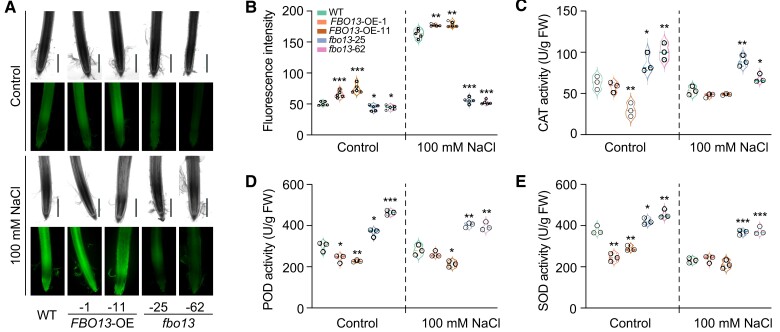
Figure 7.
OsFBO13 negatively regulates rice salinity stress response. A) Concentration of H2O2 detected by H2DCF-DA staining in roots of the WT and OsFBO13 transgenic lines with or without 100 mM NaCl treatment. Bars = 500 µm. B) Quantitative analysis of H2O2 in the roots of WT and OsFBO13 transgenic lines with or without 100 mM NaCl treatment. Values are means ± SDs (n = 5 independent root tips). C) to E) Enzyme activities of catalase (CAT; C), peroxidase (POD; D), and superoxide dismutase (SOD; E) in the WT and OsFBO13 transgenic lines with or without 100 mM NaCl treatment. WT, wild type. FBO13-OE, OsFBO13 overexpression lines. fbo13, OsFBO13 knockout lines. Values are means ± SDs of 3 biological replicates. For this figure, asterisks indicate significant differences between the wild-type and the other genotypes by a two-tailed Student's t-test (*P < 0.05, **P < 0.01, and ***P < 0.001).

