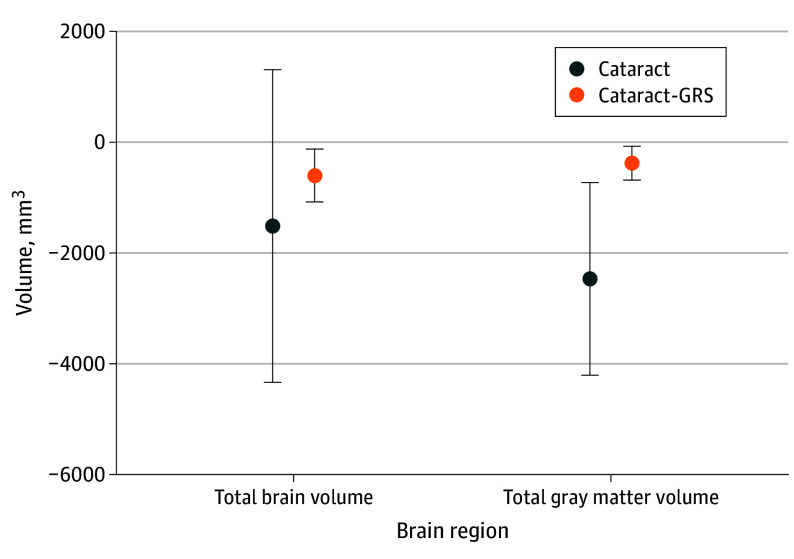
Figure 2. Association Between Cataracts or Cataracts-Genetic Risk Scores (GRS) and Total Brain and Gray Matter Volumes .
Models for cataracts include adjustment for age at visit, self-reported sex, self-reported racial and ethnic identity, index of multiple deprivation by country of origin, binary indicators for history of comorbidities (falls, broken bones, cardiovascular disease, stroke, diabetes, and problems hearing), and imaging center. Models for cataracts-GRS (primary) include adjustment for age, sex, first 10 principal components, imaging center, and intracranial volume. Error bars indicate 95% CI.

