. 2015 Jul 3;17(30):19844–19853. doi: 10.1039/c5cp01806d

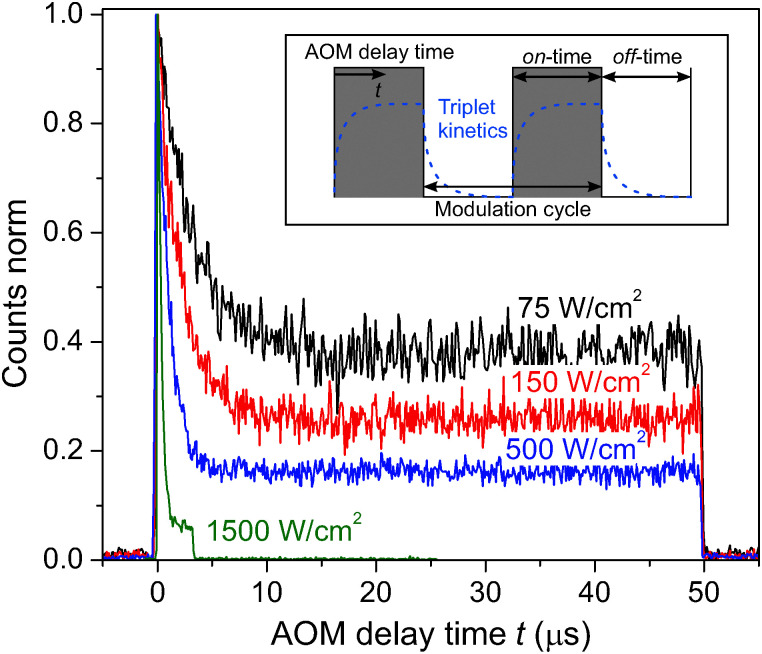
Fig. 3. Fluorescence intensity kinetics of single LHCII complexes after the onset of illumination (at t = 0) for different excitation intensities and the same excitation modulation, ton + toff = 50 μs + 50 μs = 100 μs. These kinetics (AOM histograms) were extracted by histogramming the absolute fluorescence photon arrival times into one modulation cycle with a binning time of 100 ns (gray-shaded region in the inset). The measurement at the highest excitation intensity (green curve) had a shorter on-time of 3.3 μs in order to prevent fast photo-bleaching at such a high excitation intensity. Inset: Illustration of the stepwise amplitude modulation of the excitation light via an acousto-optic modulator. By effectively turning the excitation laser on and off on the μs time range we can control the time-dependent changes in the concentration of triplets, as schematically shown with the dashed blue line. The varying concentration of triplets can then be observed via the measured fluorescence intensity kinetics.

Fig. 3