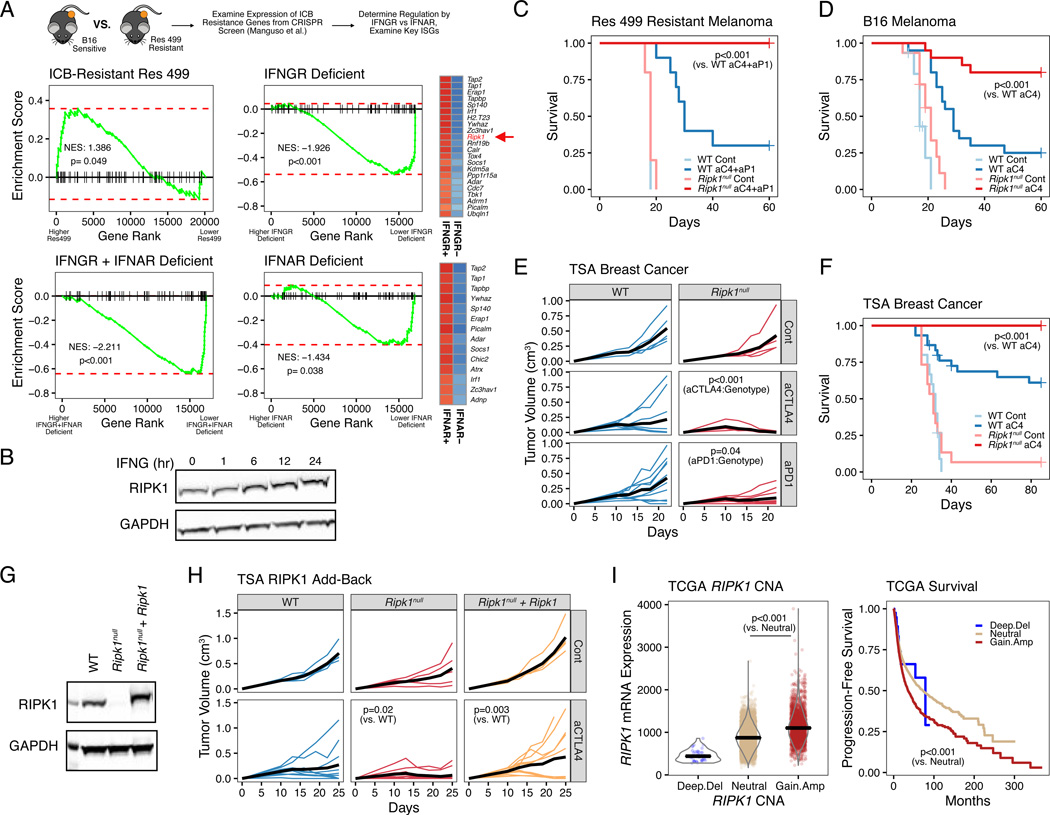
Figure 1. RIPK1 is an interferon stimulated gene that promotes resistance to cancer immune checkpoint blockade.
A. Gene set enrichment analysis (GSEA) of anti-PD1-based therapy resistance genes in untreated Res 499 melanoma cells vs. B16 parental cells (top left), Res 499 vs. Res 499 IFNGR + IFNAR deficient (bottom left), Res 499 IFNGR + IFNAR deficient vs. Res 499 IFNAR deficient (top right), or Res 499 IFNGR + IFNAR deficient vs Res 499 IFNGR deficient (bottom right). Cancer cells were sorted from in vivo tumors. Heatmaps for resistance genes most impacted by IFNGR or IFNAR deficiency are shown (leading edge genes) with blue indicating decreased expression.
B. Protein expression of RIPK1 in TSA breast cancer cells treated with 100 ng/ml recombinant murine IFNG at indicated timepoints.
C-D. Survival analysis of mice bearing Res 499 tumors (n=5–10, 1 independent experiment) (C) or B16 tumors (n=15–20, 3 independent experiments) (D) with gRNA control (WT) or RIPK1
CRISPR-mediated deletion (Ripk1null) and treated with or without anti-CTLA4 (aC4) +/− anti-PDL1 (aP1).
E. Tumor growth curves of mice with control or Ripk1null TSA breast cancer tumors treated with or without anti-CTLA4 (aCTLA4) or anti-PD1 (aPD1) (n=5–10, 1 independent experiment). P-values indicate interaction between treatment and genotype (i.e., effect of treatment is influenced by genotype).
F. Survival analysis of mice with WT or Ripk1null TSA tumors treated with or without anti-CTLA4 (n=15–30, 3 independent experiments).
G-H. RIPK1 protein expression (G) and tumor growth curves (H) of empty vector expressing WT or Ripk1null TSA cells, or Ripk1null cells with ectopic WT Ripk1. Mice were treated with or without anti-CTLA4 (n=5–10, representative of 3 independent experiments).
I. Association between RIPK1 copy number alterations (CNA) and mRNA expression (left) or progression-free survival (right) from pan-cancer TCGA patients (n=10,713).
P-values for survival were determined by log-rank test. Mixed effect model was used for tumor growth analysis. For comparison between two groups, a two-sided Wilcoxon test was used for non-parametric data, and for multiple groups a Kruskal-Wallis test is used.

