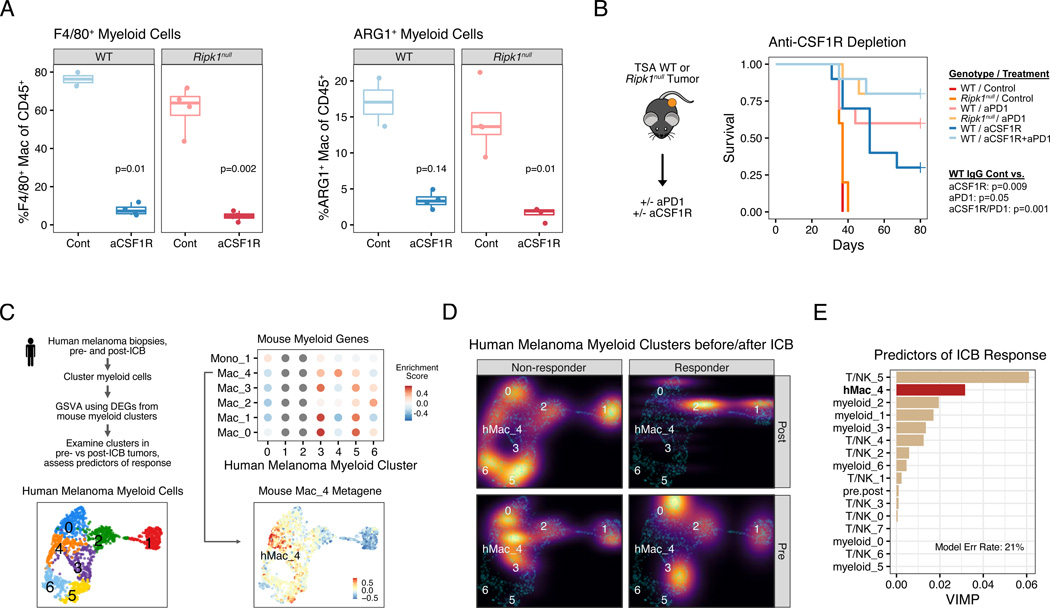
Figure 5. ARG1+ suppressive macrophages predict clinical response to ICB and their loss through myeloid cell depletion phenocopies RIPK1 deletion.
A. Flow cytometric analysis of anti-CSF1R (aCSF1R) mediated depletion of F4/80+ macrophages (left) and ARG1+F4/80+ macrophages (right).
B. Survival of mice bearing WT or Ripk1null TSA tumors treated with anti-CSF1R, anti-PD1 (aPD1), or both (n=5–10, 1 independent experiment).
C. Schema for analyzing enrichment of genes from mouse myeloid clusters (see Figure 4B) in myeloid cells from human melanomas. Shown are UMAPs of myeloid clusters from human melanoma (bottom left), enrichment for differentially expressed genes from mouse myeloid clusters in each human myeloid cluster (top right), and the median expression of genes from mouse Mac_4 cluster overlaid on the human myeloid cluster UMAP (bottom right).
D. Density plot of myeloid clusters from human melanoma from patients treated with anti-PD1 +/− anti-CTLA4. Plots are stratified by ICB response (columns) and pre- and post-ICB biopsies (rows). For presentation purposes, densities for each condition are overlaid on UMAP from (C) (cyan dots).
E. Multivariable random forest model for probability of response for melanoma patients treated with anti-PD1 +/− anti-CTLA4. Shown are the variable importance scores, which represents the increase in classification error rate when the variable is perturbed, for each myeloid and T/NK clusters. The classification error rate for the model is 21%.
For comparison between two groups, a two-sided T-test or Wilcoxon test was used for parametric or non-parametric data, respectively.

