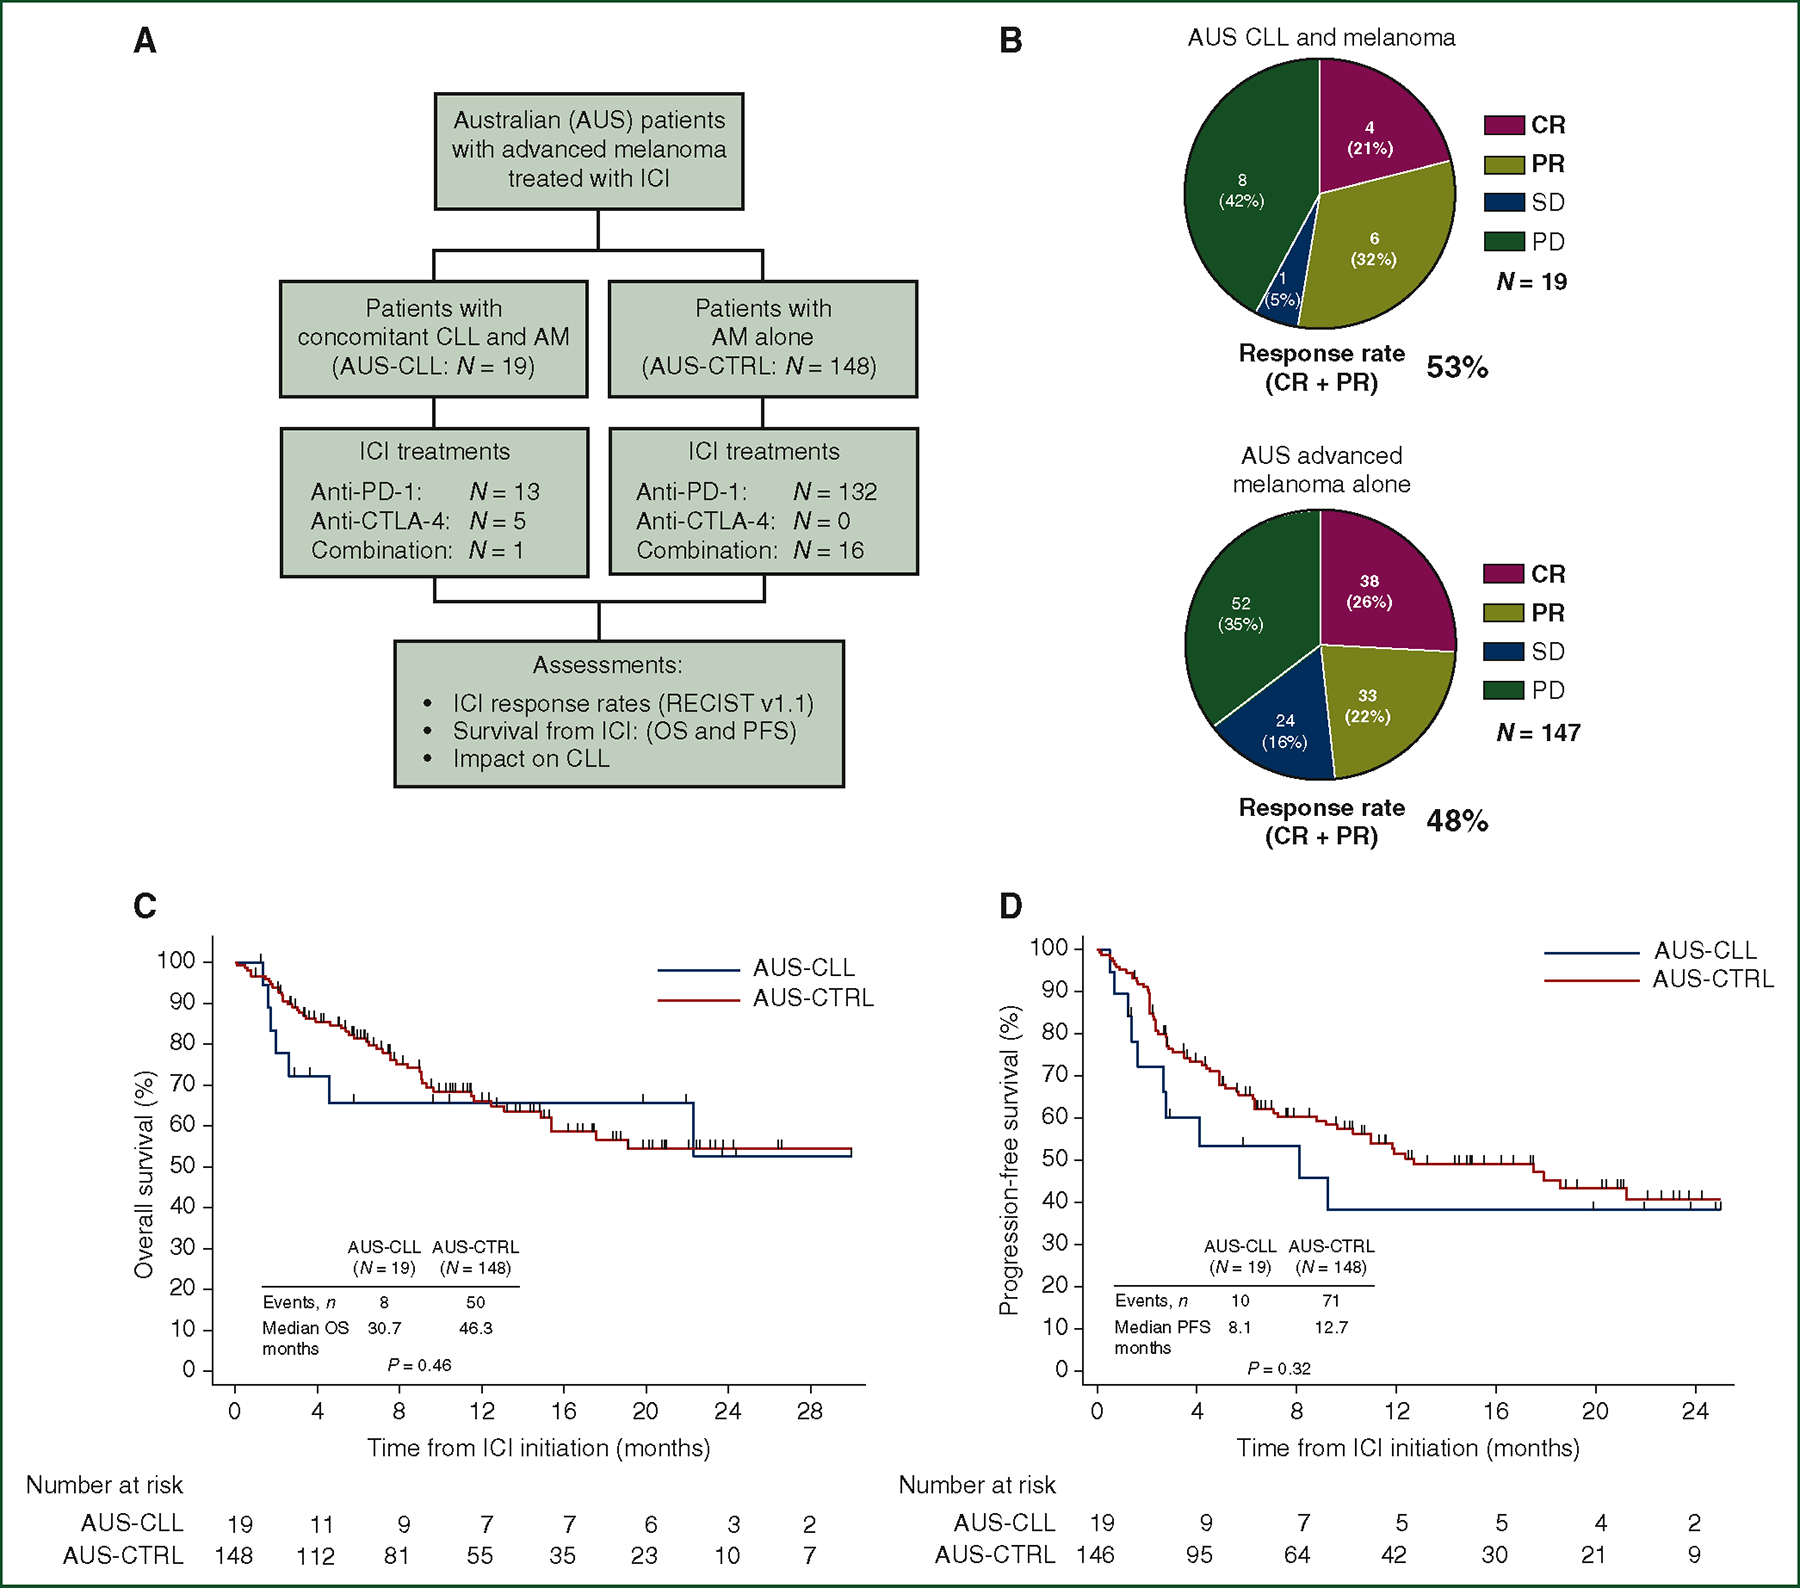
Figure 1. AM response rates and survival following ICI, in the absence or presence of concomitant CLL.

(A) CONSORT diagram describing the comparison of ICI-dependent outcomes between Australian patients with concomitant CLL and AM (N = 19) versus AM alone (N = 148). (B) Pie charts describing radiographic response by RECIST v1.1 assessment in Australian cohorts of patients treated with ICI for AM in the presence of concomitant CLL (top, AUS-CLL, N = 19) or absence of concomitant CLL (bottom, AUS-CTRL, N = 147, *response data available for 147 patients). Objective responses (CR or PR) resulted in 53% of patients with CLL and AM versus 48% in patients with AM alone (P = 0.81). (C) Kaplan–Meier plot comparing OS between patients with concomitant CLL and AM (AUS-CLL, P = 19) and AM alone (AUS-CTRL) (P = 167, P = 0.46 by log-rank test). (D) Kaplan–Meier plot comparing PFS between patients with concomitant CLL and AM (AUS-CLL, N = 19) and AM alone (AUS-CTRL) (N = 167, P = 0.32 by log-rank test).
AM, advanced melanoma; CLL, chronic lymphocytic leukemia; CR, complete response; CTLA-4, cytotoxic T-lymphocyte-associated protein 4; ICI, immune checkpoint inhibitor; OS, overall survival; PD, progressive disease; PD-1, programmed cell death protein 1; PFS, progression-free survival; PR, partial response; SD, stable disease.
