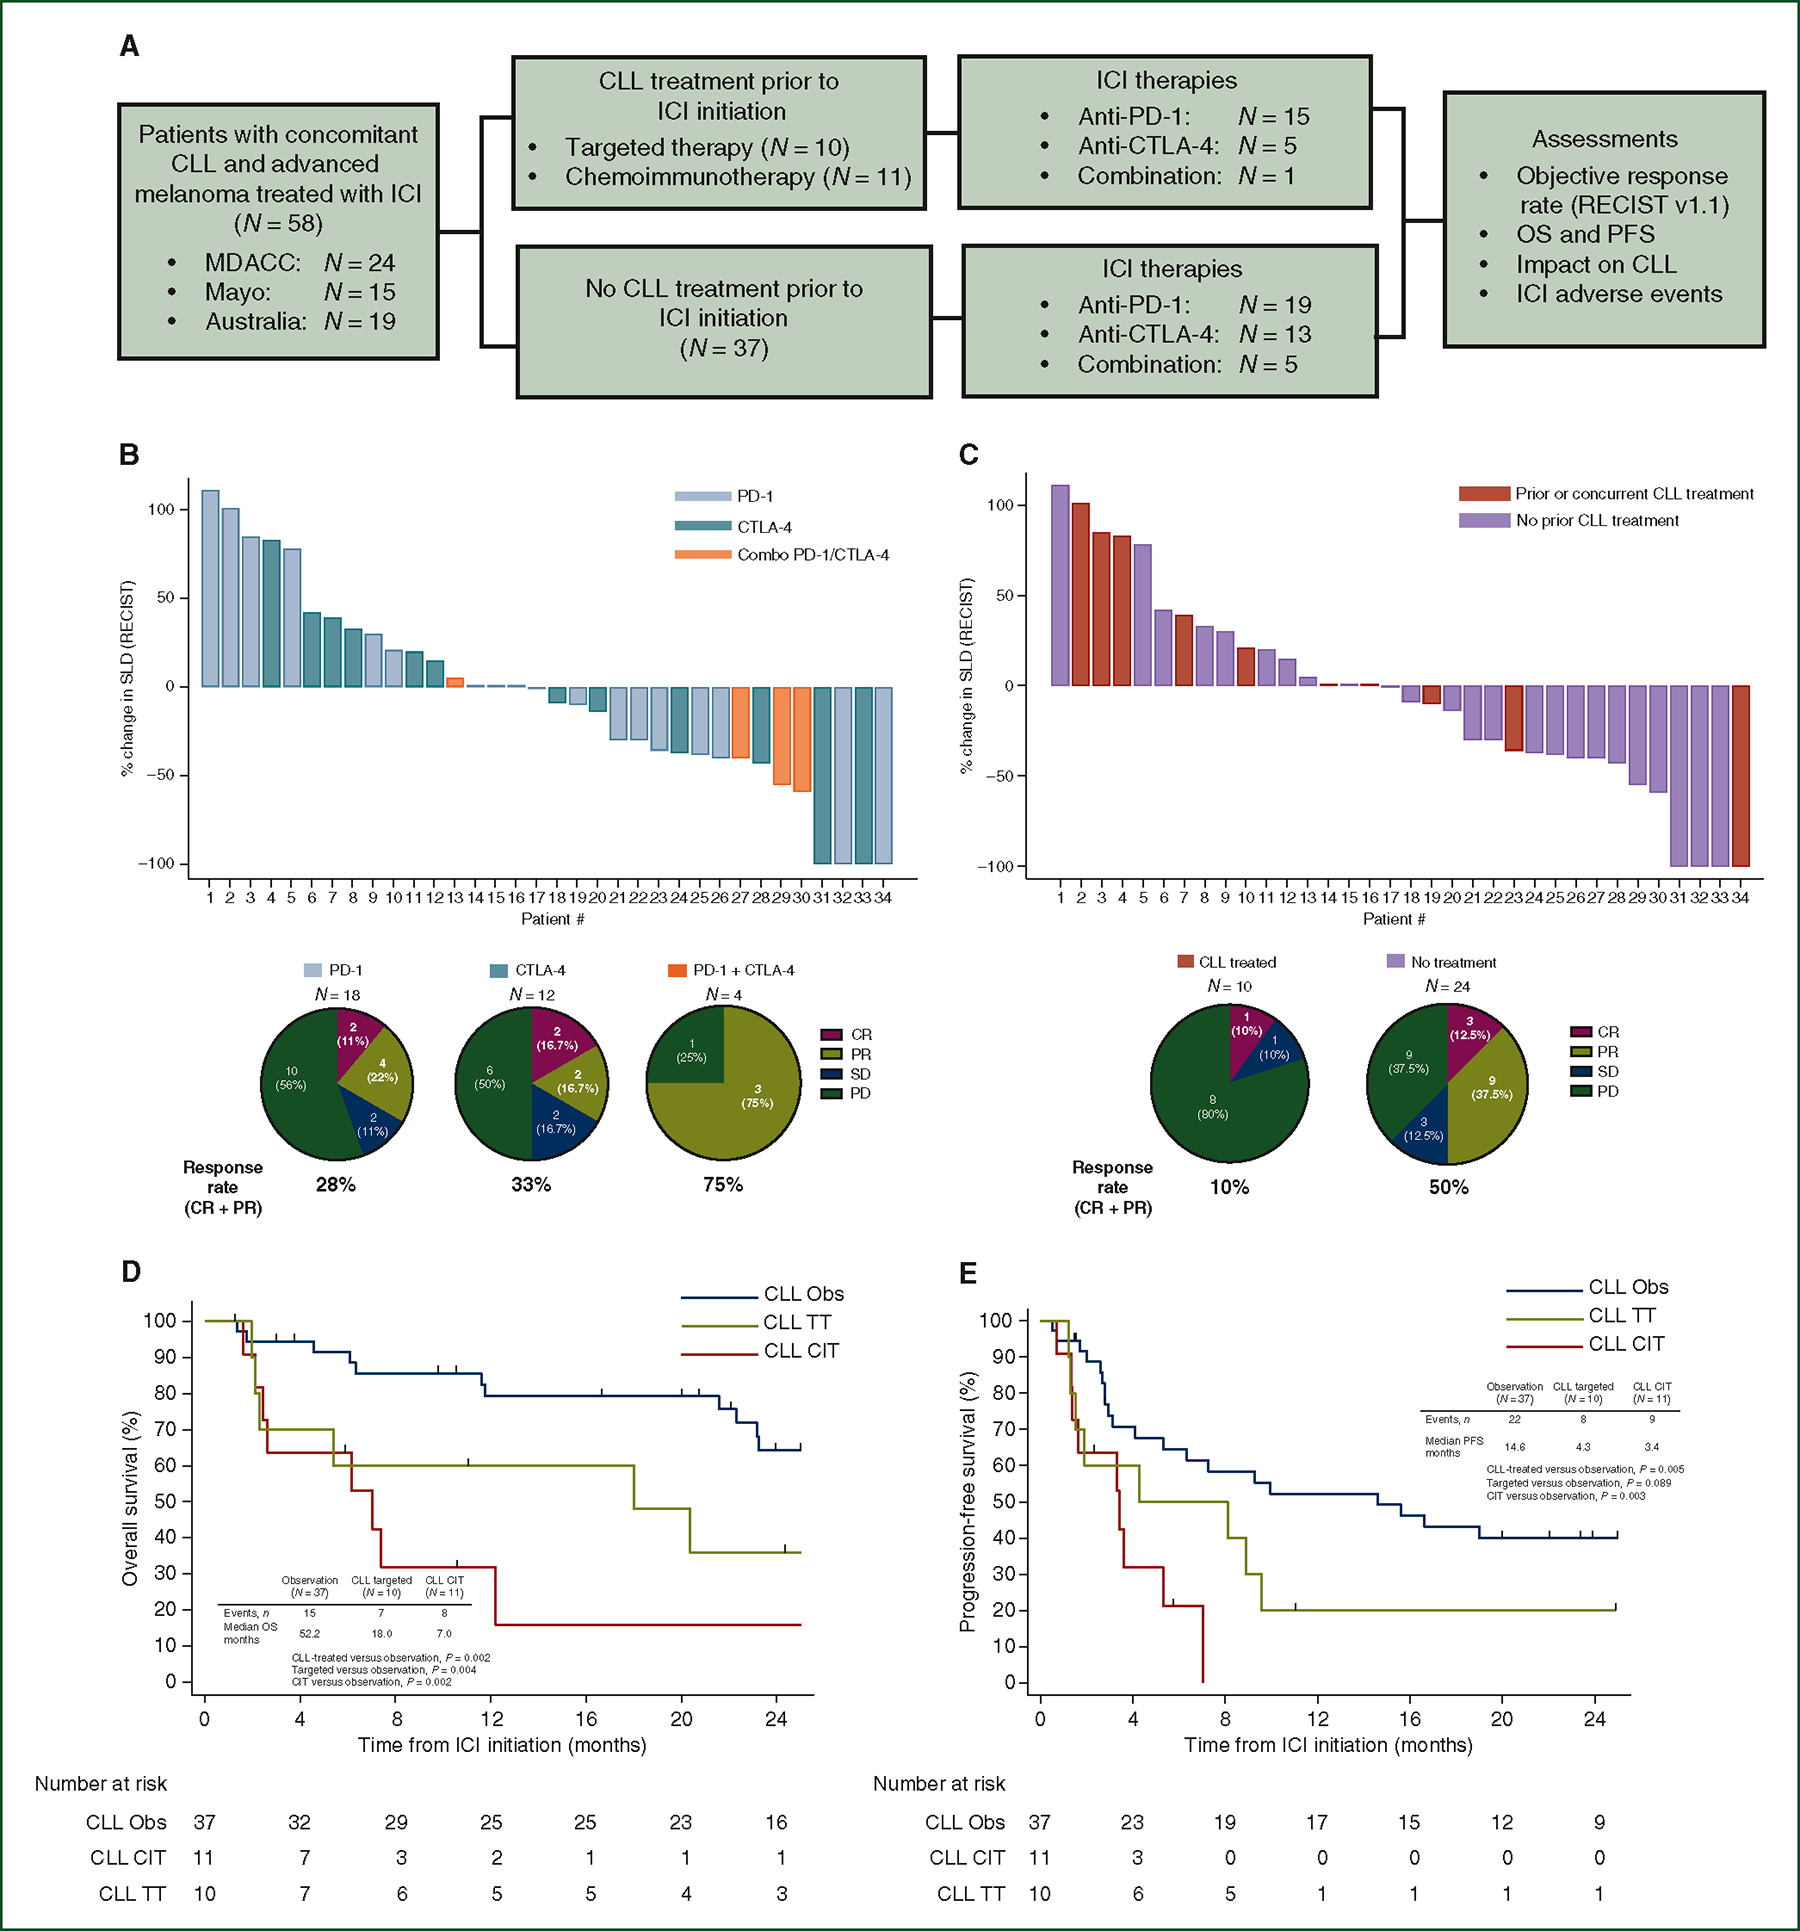
Figure 2. Sub-analysis of ICI-dependent outcomes (ORR, OS, and PFS) among patients with concomitant CLL and AM by ICI subtype and patient history of prior CLL therapy.

(A) CONSORT diagram describing the comparison of ICI-dependent outcomes among all patients with concomitant CLL and AM, stratified by whether patients had prior treatment for their CLL. (B) Waterfall plot describing response to first-line ICI as percentage change in SLD of metastatic melanoma by RECIST v1.1, stratified by type of ICI subtype. These plots display evaluable radiographic responses (N = 34) from ICI treatments from the US cohorts (N = 39). Pie charts, below, further describe radiographic response in this cohort. (C) Waterfall plots describing radiographic response to first-line ICI as percentage change SLD of metastatic melanoma, stratified by whether patients had received prior CLL treatment. These plots include evaluable radiographic responses (N = 34) from ICI treatments from the US cohorts (N = 39). Pie charts, below, further describe response in this cohort. Kaplan–Meier plots comparing OS (D) and PFS (E) between patients with no prior CLL treatment (CLL observation), prior treatment with targeted therapies, or prior treatment with chemoimmunotherapy.
AM, advanced melanoma; CLL, chronic lymphocytic leukemia; CR, complete response; CTLA-4, cytotoxic T-lymphocyte-associated protein 4; ICI, immune checkpoint inhibitor; OS, overall survival; PD, progressive disease; PD-1, programmed cell death protein 1; PFS, progression-free survival; PR, partial response; SD, stable disease; SLD, sum of longest diameter.
