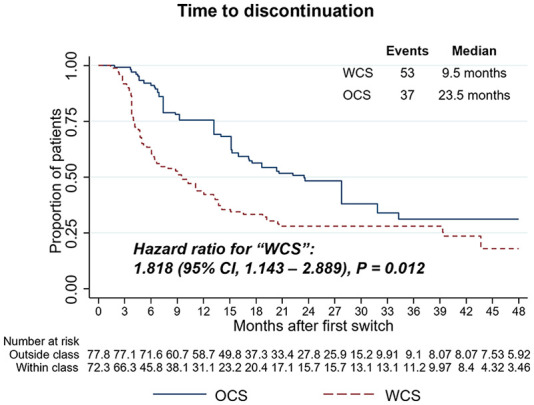
Figure 3.

Weighted Kaplan–Meier and Cox proportional hazards models for time to treatment discontinuation (60-day gap definition) comparing WCS and OCS. HRs, 95% CIs, and p values demonstrate statistical differences between cohorts.
CI, confidence interval; HR, hazard ratio; OCS, outside-class switchers; WCS, within-class switchers.
