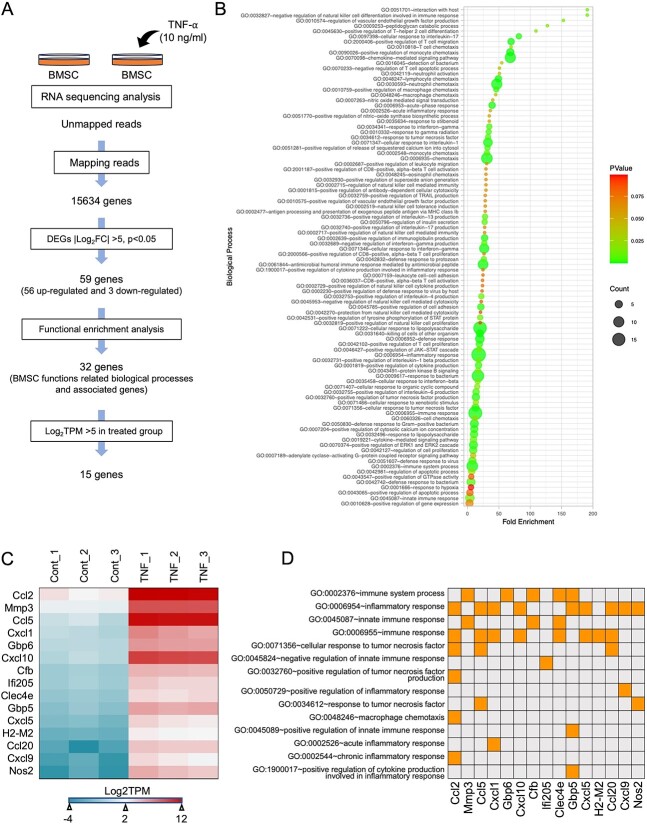
Figure 5.
Comprehensive analysis of TNF-α stimulation-specific MSCs transcriptomes revealed that 15 immune-related genes were significantly upregulated in TNF-α-stimulated MSCs. (A) Flow chart of BMSC function-related gene screening. We analyzed DEGs of TNF-α-stimulated and unstimulated MSCs and cut-off values of p<.05 and |log2Fold Change| >5. We performed functional enrichment analysis using DAVID Version 6.8 and selected BMSC function-related biological processes. We observed highly expressed genes in the TNF-α-stimulated MSCs group with absolute log2TPM > 5. (B) Bubble plot for functional enrichment analysis of 59 genes using R v4.22. (C) Heatmap of the expression levels of selected genes with high expression in TNF-α-stimulated MSCs. (D) Table presentation of biological processes related to highly expressed genes in TNF-α-stimulated MSCs.

