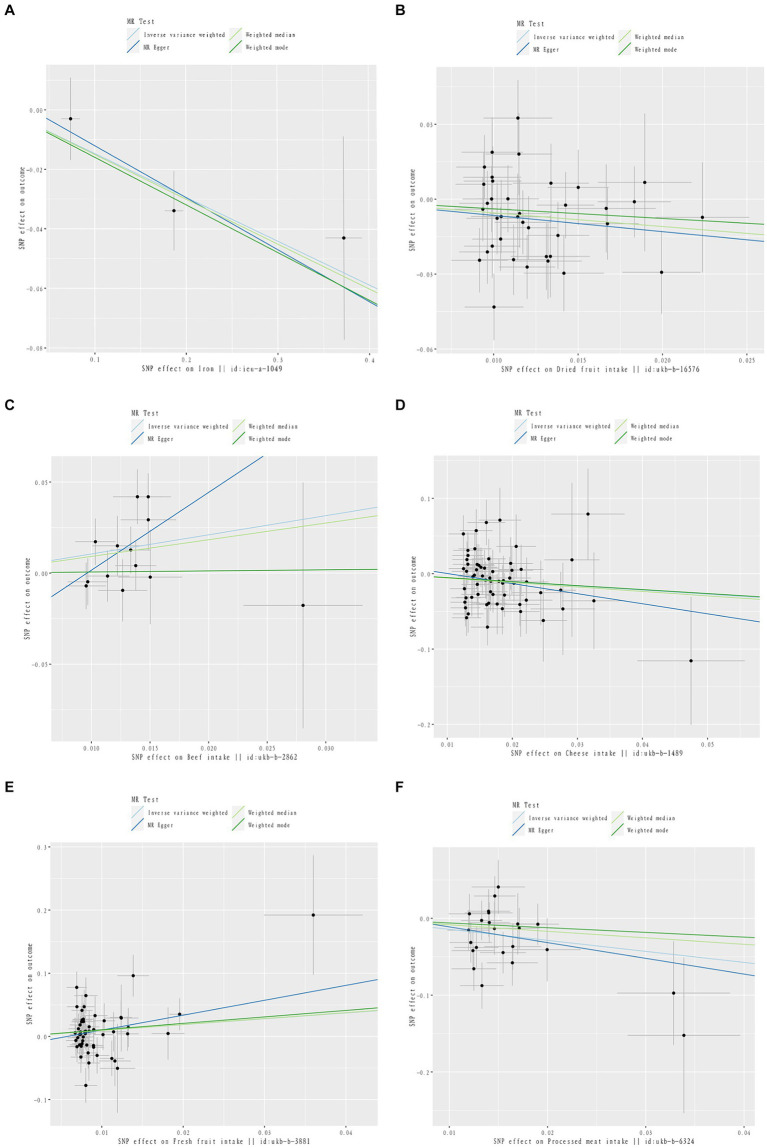
Figure 3.
Scatter plot of causal relationship between dietary intake and different phenotypes of inflammatory arthritis. The causal effects of iron intake on RA in different MR methods (A). The causal effects of dried fruit intake on RA in different MR methods (B). The causal effects of Beef intake on RA in different MR methods (C). The causal effects of Cheese intake on PsA in different MR methods (D). The causal effects of Fresh fruit intake on PsA in different MR methods (E). The causal effects of processed meat intake on ReA in different MR methods (F).

