Fig. 1.
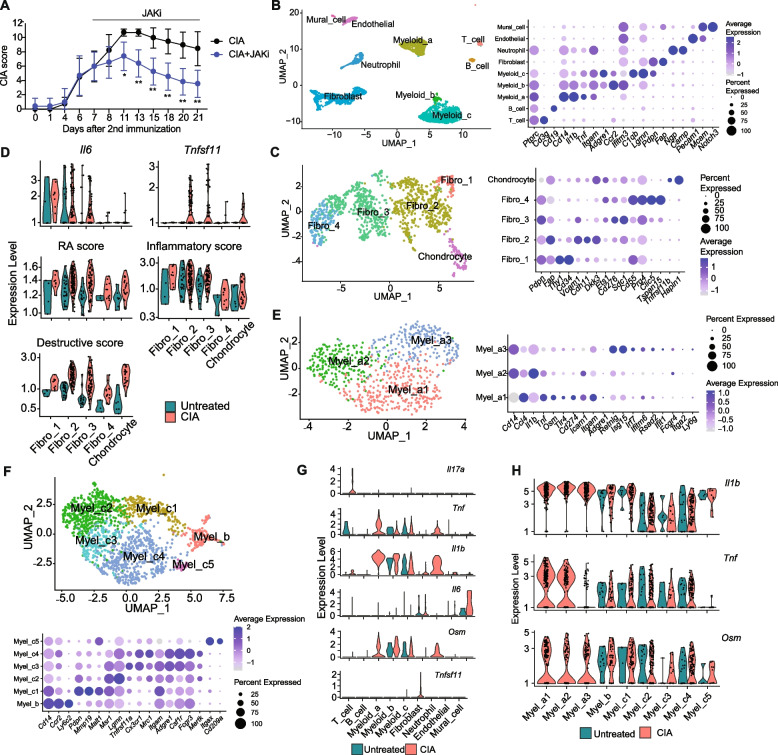
Characterization of synovial fibroblasts and macrophages in CIA synovium by single-cell analysis. A The arthritis score of CIA mice which were administered upadacitinib, a JAK inhibitor (JAKi) from 7 to 21 days after the 2nd immunization. B Main clusters of the sc-RNAseq data in the untreated, CIA and CIA + JAKi group (left), and the average expression of the representative markers of each cell type (right). C Sub-clusters of synovial fibroblasts (left), and the average expression of the representative markers (right). D Expression of Il6 and Tnfsf11 (top), RA, inflammatory and destructive scores (middle and bottom) in synovial fibroblast. E Sub-clusters of Itgam (CD11b)+ Adgre1 (F4/80)− circulating monocytes Myel_a (left panel), and the average expression of markers (right panel). F Sub-clusters of Itgam+Adgre1.+ macrophages Myel_b and _c (left) and the average expression of representative markers (right). G The expression level of Il17a, Tnf, Il1b, Il6, Osm, and Tnfsf11 genes in main-clusters under the untreated and CIA conditions. H The expression level of Il1b, Tnf, and Osm genes in all myeloid sub-clusters under untreated and CIA conditions. All data are expressed as the mean ± SD with n = 4–7, *p < 0.05, **p < 0.01, by unpaired Student's t-test (A)

