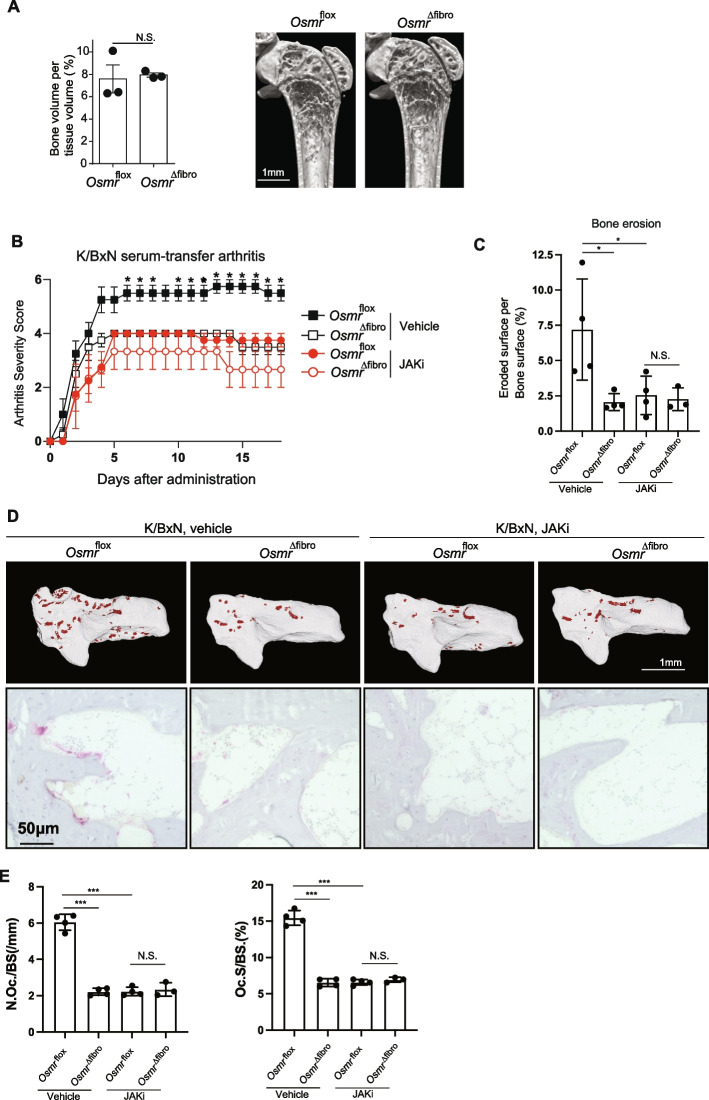
Fig. 7.
The critical role of fibroblast-OSM signaling in arthritis as a key target of JAK inhibitors in vivo. A Bone volume per tissue volume (left) and representative micro-CT images of the femur of untreated Osmrflox and Osmr∆fibro mice (n = 3, respectively, right). Scale bar: 1 mm. B Arthritis score of the hind paws of K/BxN serum-transfer arthritis Osmrflox (vehicle, n = 4), Osmr∆fibro (vehicle, n = 3), Osmrflox (the JAK inhibitor, n = 4), Osmr∆fibro (the JAK inhibitor, n = 3). C Eroded surface per bone surface of the calcaneus of Osmrflox (vehicle, n = 4), Osmr∆fibro (vehicle, n = 3), Osmrflox (the JAK inhibitor, n = 4), Osmr∆fibro (the JAK inhibitor, n = 3) in K/BxN serum-transfer arthritis. D Representative μCT images (upper panel) and TRAP staining (lower panel) of the calcaneus of K/BxN serum-transfer arthritis mice. The red colored area indicates cavities (upper) and TRAP+ osteoclast (lower). Scale bar: 1 mm (upper) and 50 µm (lower). E The number and surface of TRAP+ multinucleated cells per bone surface in the calcanueous of Osmrflox (vehicle, n = 4), Osmr∆fibro (vehicle, n = 3), Osmrflox (the JAK inhibitor, n = 4), Osmr∆fibro (the JAK inhibitor, n = 3) in K/BxN serum-transfer arthritis. All data are expressed as the mean ± S.E.M. *p < 0.05, **p < 0.01, ***p < 0.001 by unpaired Student’s t test (A), 2-way ANOVA with the Tukey’s multiple-comparison test (B, C, E), N.S., not significant

