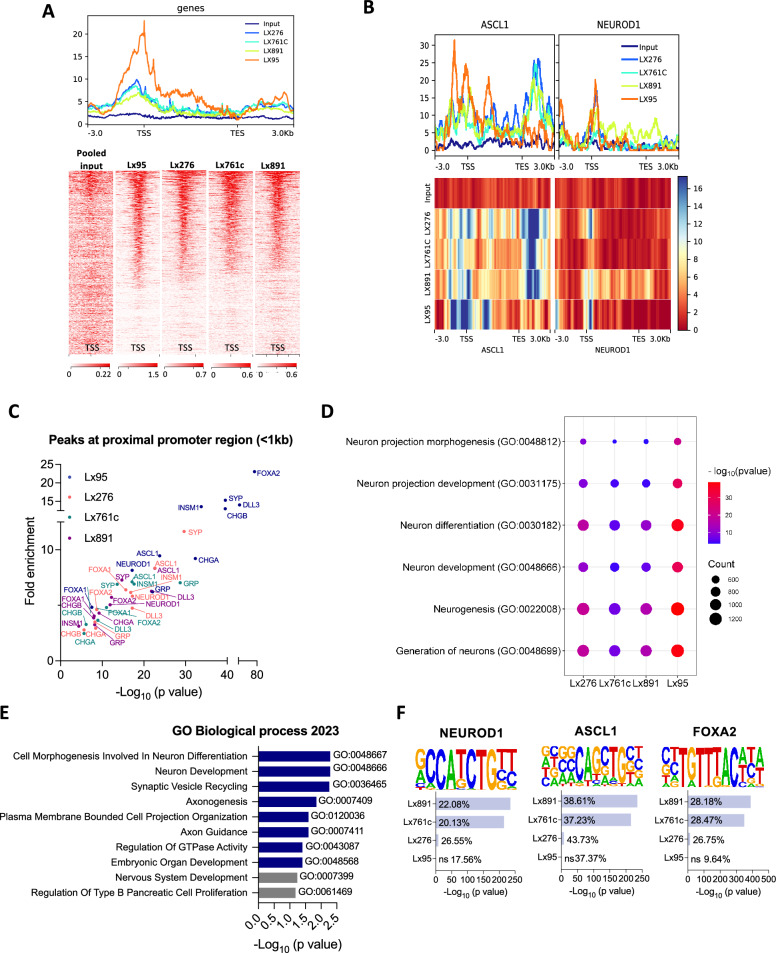
Fig. 4.
SMARCA4 binds to neuronal and NE lineage TF genes in SCLC. A Heatmap and metaplot showingSMARCA4 binding profile determined by ChIP-seq in 4 NE SCLC PDXs and a pooled input. The range under the map indicates the ChIP-seq signal intensity. B Metaplots of ASCL1 and NEUROD1 in all PDXs and input. Heatmaps showing the binding of SMARCA4 to ASCL1 and NEUROD1 gene bodies. The range indicates the normalized enrichment along the respective gene regions. C NE lineage TFs and gene promoter proximal regions (within 1 kb of TSS) bound by SMARCA4 in NE SCLC PDXs. D Dot plot of Poly-Enrich analysis applied to SMARCA4 ChIP-seq peaks. Fold enrichment refers to the fold increase in the signal for a particular gene relative to the background signal. The counts refer to the number of genes detected in the ChIP-seq data that are part of the indicated pathways. E Enrich analysis of 617 consensus genes selected by combining RNAseq from Fig. 2 and ChIP-seq data. See also Fig. S5E. F Enrichment analysis of TF-binding motifs in the SMARCA4 ChIP-seq data identified with HOMER. See also Figs. S5, S6 and Table S3

