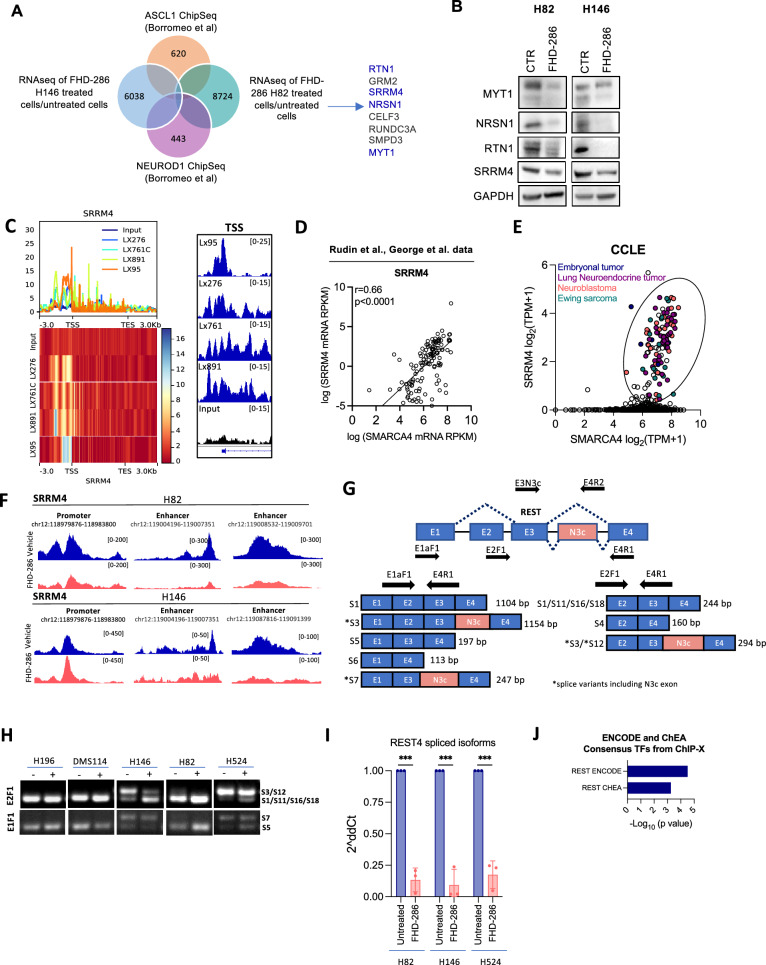
Fig. 5.
SMARCA4 regulates SRRM4 expression to control splicing and activation of REST. A Venn diagram of ASCL1 and NEUROD1 published binding targets from Borromeo et al. [7] overlapping with genes downregulated by FHD-286 in H146 and H82 cells. B Western blots of H82 and H146 cells treated with FHD-286 for 14 days. C Metaplot of SMARCA4 ChIP-seq showing SMARCA4 binding to SRRM4 in 4 NE SCLC PDXs. Range indicates the fold enrichment with respect the input. ChIP-seq genome tracks at SRRM4 TSS. Graphs were obtained from IGV. D Correlation of SMARCA4 and SRRM4 mRNA levels in SCLC patients’ database. Spearman correlation. E Correlation analysis of SRRM4 and SMARCA4 in cancer cell lines retrieved from CCLE. Cell lines with both high SMARCA4 and SRRM4 mRNA levels are highlighted. F Merged ATAC-seq tracks of H82 and H146 parentals cells and FHD-286 treated cells (day 14) at SRRM4 gene locus visualized with IGV. G Graphical representation of REST genomic regions and spliced isoforms with the binding location of the different primers used for PCR. H PCR analysis of REST splicing isoforms using two pairs of primers (E2F1 + E4R1 and E1F1 + E4R1) that span N3c. I RT-qPCR of REST4 isoforms (S3, S7, S12) in H82, H146 and H524 treated with FHD-286 (14 days) versus untreated cells. The pair of primers E3N3c and E4R2 that recognizes all isoforms including exon N3c was used. Student’s two-tailed unpaired t test. ***p < 0.001. The mean ± SD is shown. J Enrich analysis applied to commonly and significantly downregulated genes in both H146 and H82 (n = 904) cell lines identified in the bulk-RNAseq (Fig. 2). See also Fig. S7

