Fig. 3.
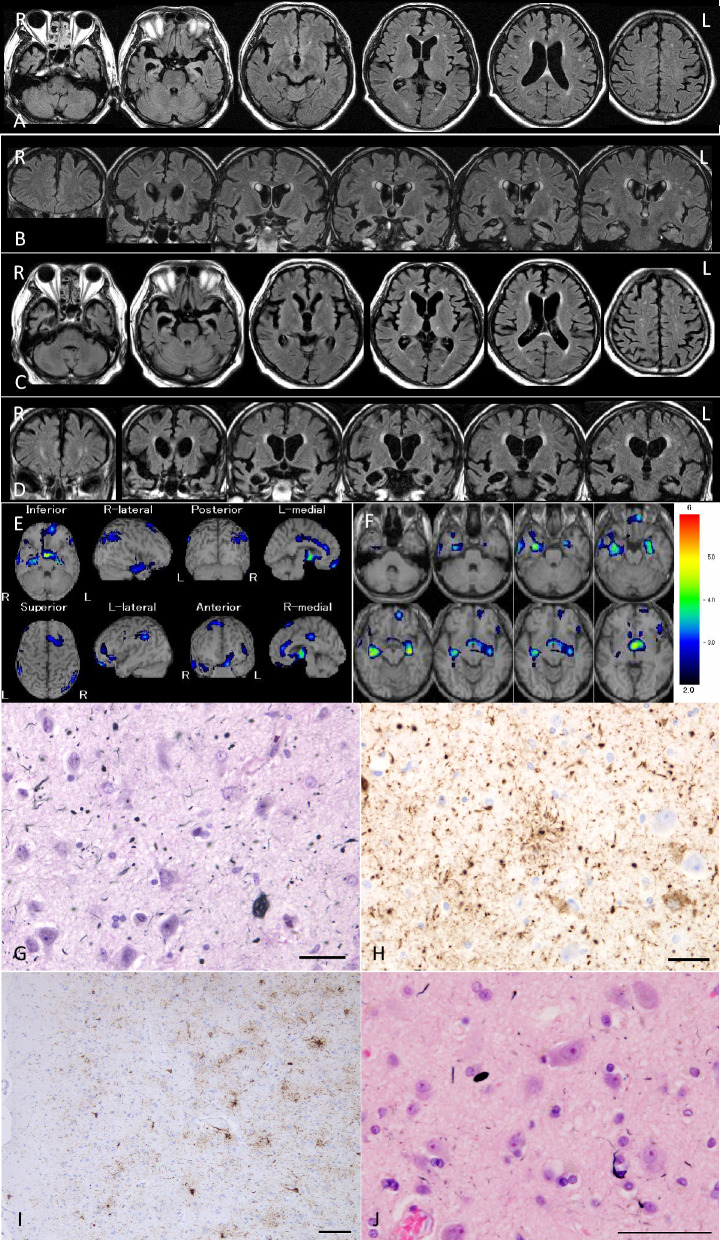
Radiological and pathological findings in case 2. A, B Axial (A) and coronal (B) MR images at the age of 69 years. The amygdala and adjacent parahippocampal gyrus show right side predominant atrophy. Temporal lobes are also atrophic, but frontal, parietal, and occipital cortices appear to be not involved. C, D Axial (C) and coronal (D) MR images at age 74. Right side-predominant atrophy in the amygdala and hippocampus become more evident. Mild frontal atrophy was also noted. E, F 99mTc ECD brain perfusion single photon computed tomography (SPECT). SPECT Z-score maps compared with the standard database (the easy Z-score imaging system (eZIS) analysis software [33]). Blue, green, and yellow colors indicate a Z-score higher than 2.0. The amygdala rather than hippocampus exhibited hypoperfusion. G AGs in the amygdala. Gallyas method. Scale bar = 30 μm. H AT8-positive GFAs and AGs in the amygdala. Scale bar = 30 μm. I Numerous AT8-positive GFAs and some pretangles in the middle frontal gyrus. Scale bar = 100 μm. J In the same region of (I), Gallyas method demonstrated AGs and a coiled body. Scale bar = 50 μm

