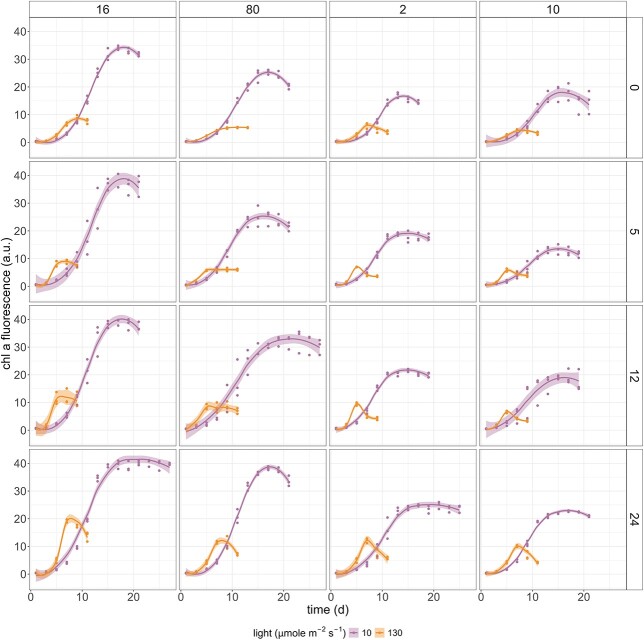
Fig. 1.
Growth curves of the experimental phytoplankton community under different salinities and inorganic nutrient ratios. From left to right: N:P = 16, 80, 2 and 10. From top to bottom: salinity = 0, 5, 12 and 24 psu. Curves are based on the in vivo chl-a fluorescence measurements, and the smoothing functions were generated using ggplot2 with shaded area representing 95% confidence intervals (smoothing method = loess).

