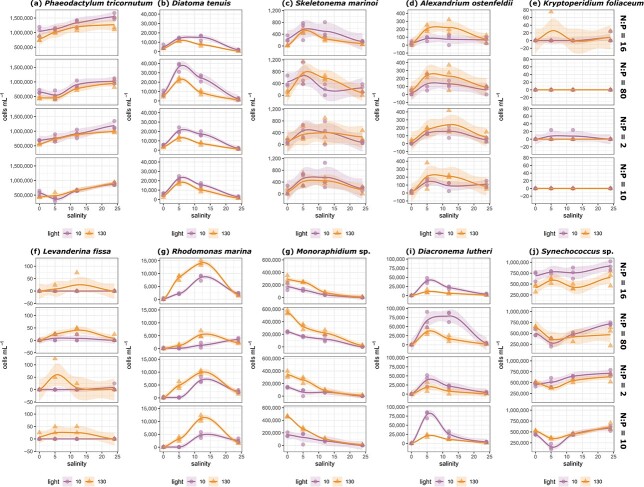
Fig. 2.
Final cell density of the 10 phytoplankton strains (a–j) along the salinity gradient under different combinations of light (circle = 10, triangle = 130 μmol photons m−2 s−1), and nutrient (N:P molar ratios, top-bottom) conditions. Smoothing function was generated using the ggplot2 package (method = loess) and shaded area represents 95% confidence intervals.

