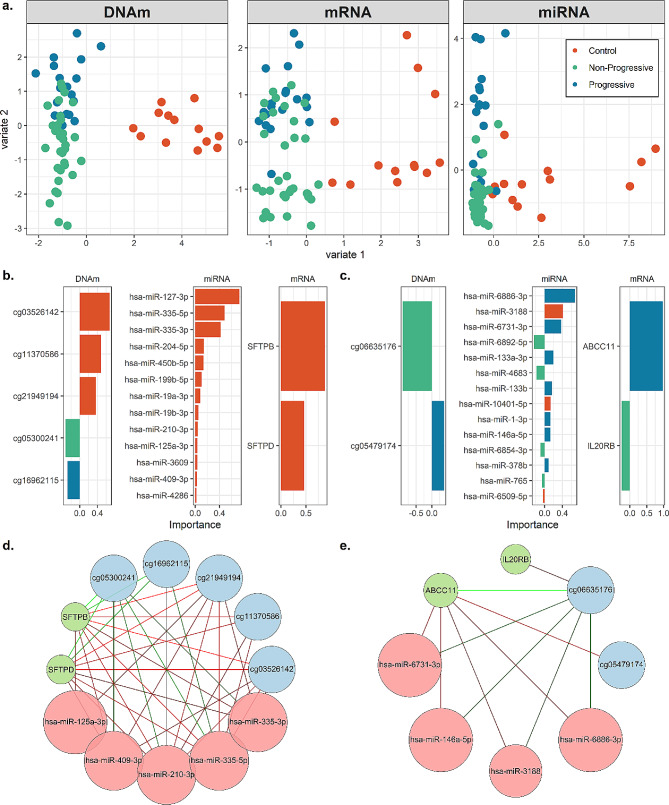
Fig. 4.
A sparse multi-omic model of sarcoidosis and progression. A) Projection of samples based on selected feature weights. Points represent samples, colored by disease group, and are plotted for each data type on the top latent variables from the DIABLO multi-omic model. B) Feature importance of selected features for latent variable (1) Bars are colored by strongest sample group loading. C) Feature importance of selected features for latent variable (2) Bars are colored by strongest sample group loading. D) Network constructed from feature correlations on latent variable (1) Features are colored by dataset. Edges are colored by feature correlation, with green representing positive correlation. Features in the network share at least 90% correlation. E) Network constructed from feature correlations on latent variable (2) Features are colored by dataset. Edges are colored by feature correlation, with green representing positive correlation. Features in the network share at least 50% correlation

