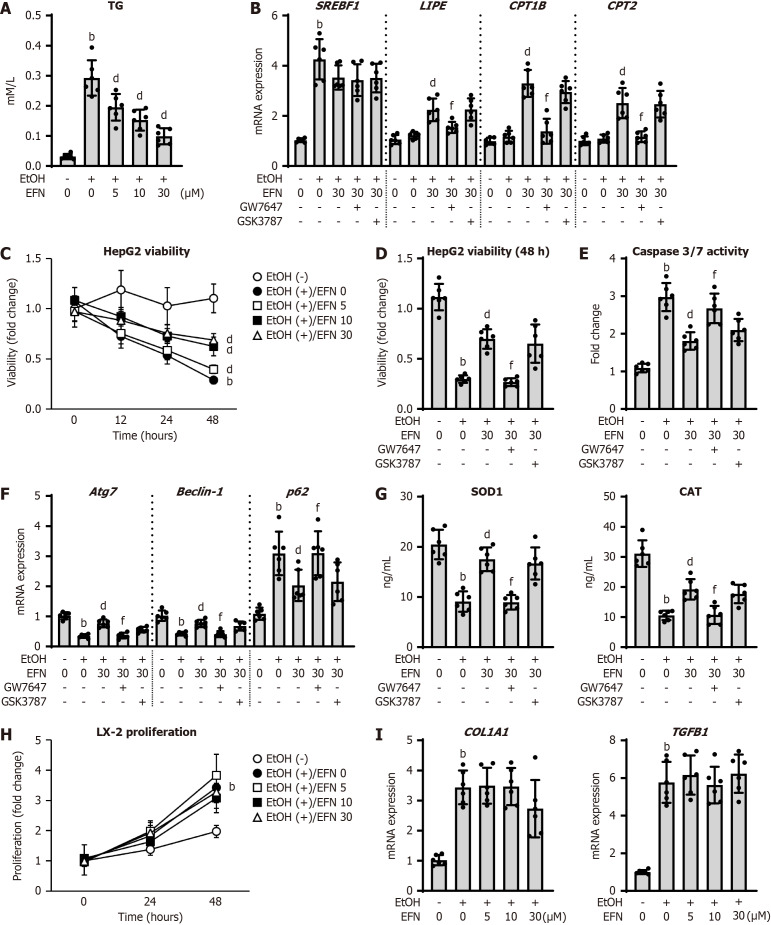
Figure 4.
Elafibranor on the ethanol-stimulated human hepatocytes and human hepatic stellate cells. A: Intracellular triglyceride content in HepG2 cells (n = 6); B: Intracellular mRNA level of the markers related to lipid metabolism in HepG2 cells (n = 6); C: Chronological change in HepG2 cell viability by treatment with ethanol (EtOH) and/or elafibtanor (EFN) (n = 6); D: Effect of a selective antagonists of peroxisome proliferator activated receptor (PPAR)α (GW7647) or PPARδ (GSK3787) on EtOH and EFN-treated HepG2 cell viability (incubation for 48 hours) (n = 6); E: Intracellular caspase 3/7 activity in HepG2 cells (n = 6); F: Intracellular mRNA level of the markers related to autophagy in HepG2 cells (n = 6); G: Intracellular levels of superoxide dismutase 1 and catalase in HepG2 cells (n = 6). HepG2 cells were incubated with (A and C) EtOH (0 or 50 mmol/L) and EFN (0, 5, 10, 30 μM) for 24 hours (A) or 0, 12, 24, and 48 hours (C), EtOH (0 or 50 mmol/L) and EFN (0 or 30 μM) for 48 hour following pretreatment with GW7647 (10 μM) or GSK3787 (10 μM) for 6 hours (B, D-G); H: Chronological change in LX-2 cell proliferation by treatment with EtOH and/or EFN (n = 6); I: Intracellular mRNA level of the profibrotic markers in LX-2 cells (n = 6). LX-2 cells were incubated with EtOH (0 or 50 mmol/L) and EFN (0, 5, 10, and 30 μM) for 0, 24, 48 hours (H) or 24 hours (I). Glyceraldehyde-3-phosphate dehydrogenase was used as an internal control for real-time quantitative polymerase chain reaction (B, F and I). Quantitative values are indicated as fold changes to the values of EtOH (-)/EFN (0 μM)-treated group (B-F, H and I). Data are the mean ± SD. bP < 0.01 vs ethanol (-)/elafibtanor (0 μM)-treated group; dP < 0.01 vs ethanol (+)/elafibtanor (0 μM)-treated group; fP < 0.01 vs ethanol (+)/elafibtanor (30 μM)-treated group. EtOH: Ethanol; EFN: Elafibtanor; SOD: Superoxide dismutase; CAT: Catalase; TG: Triglyceride.

