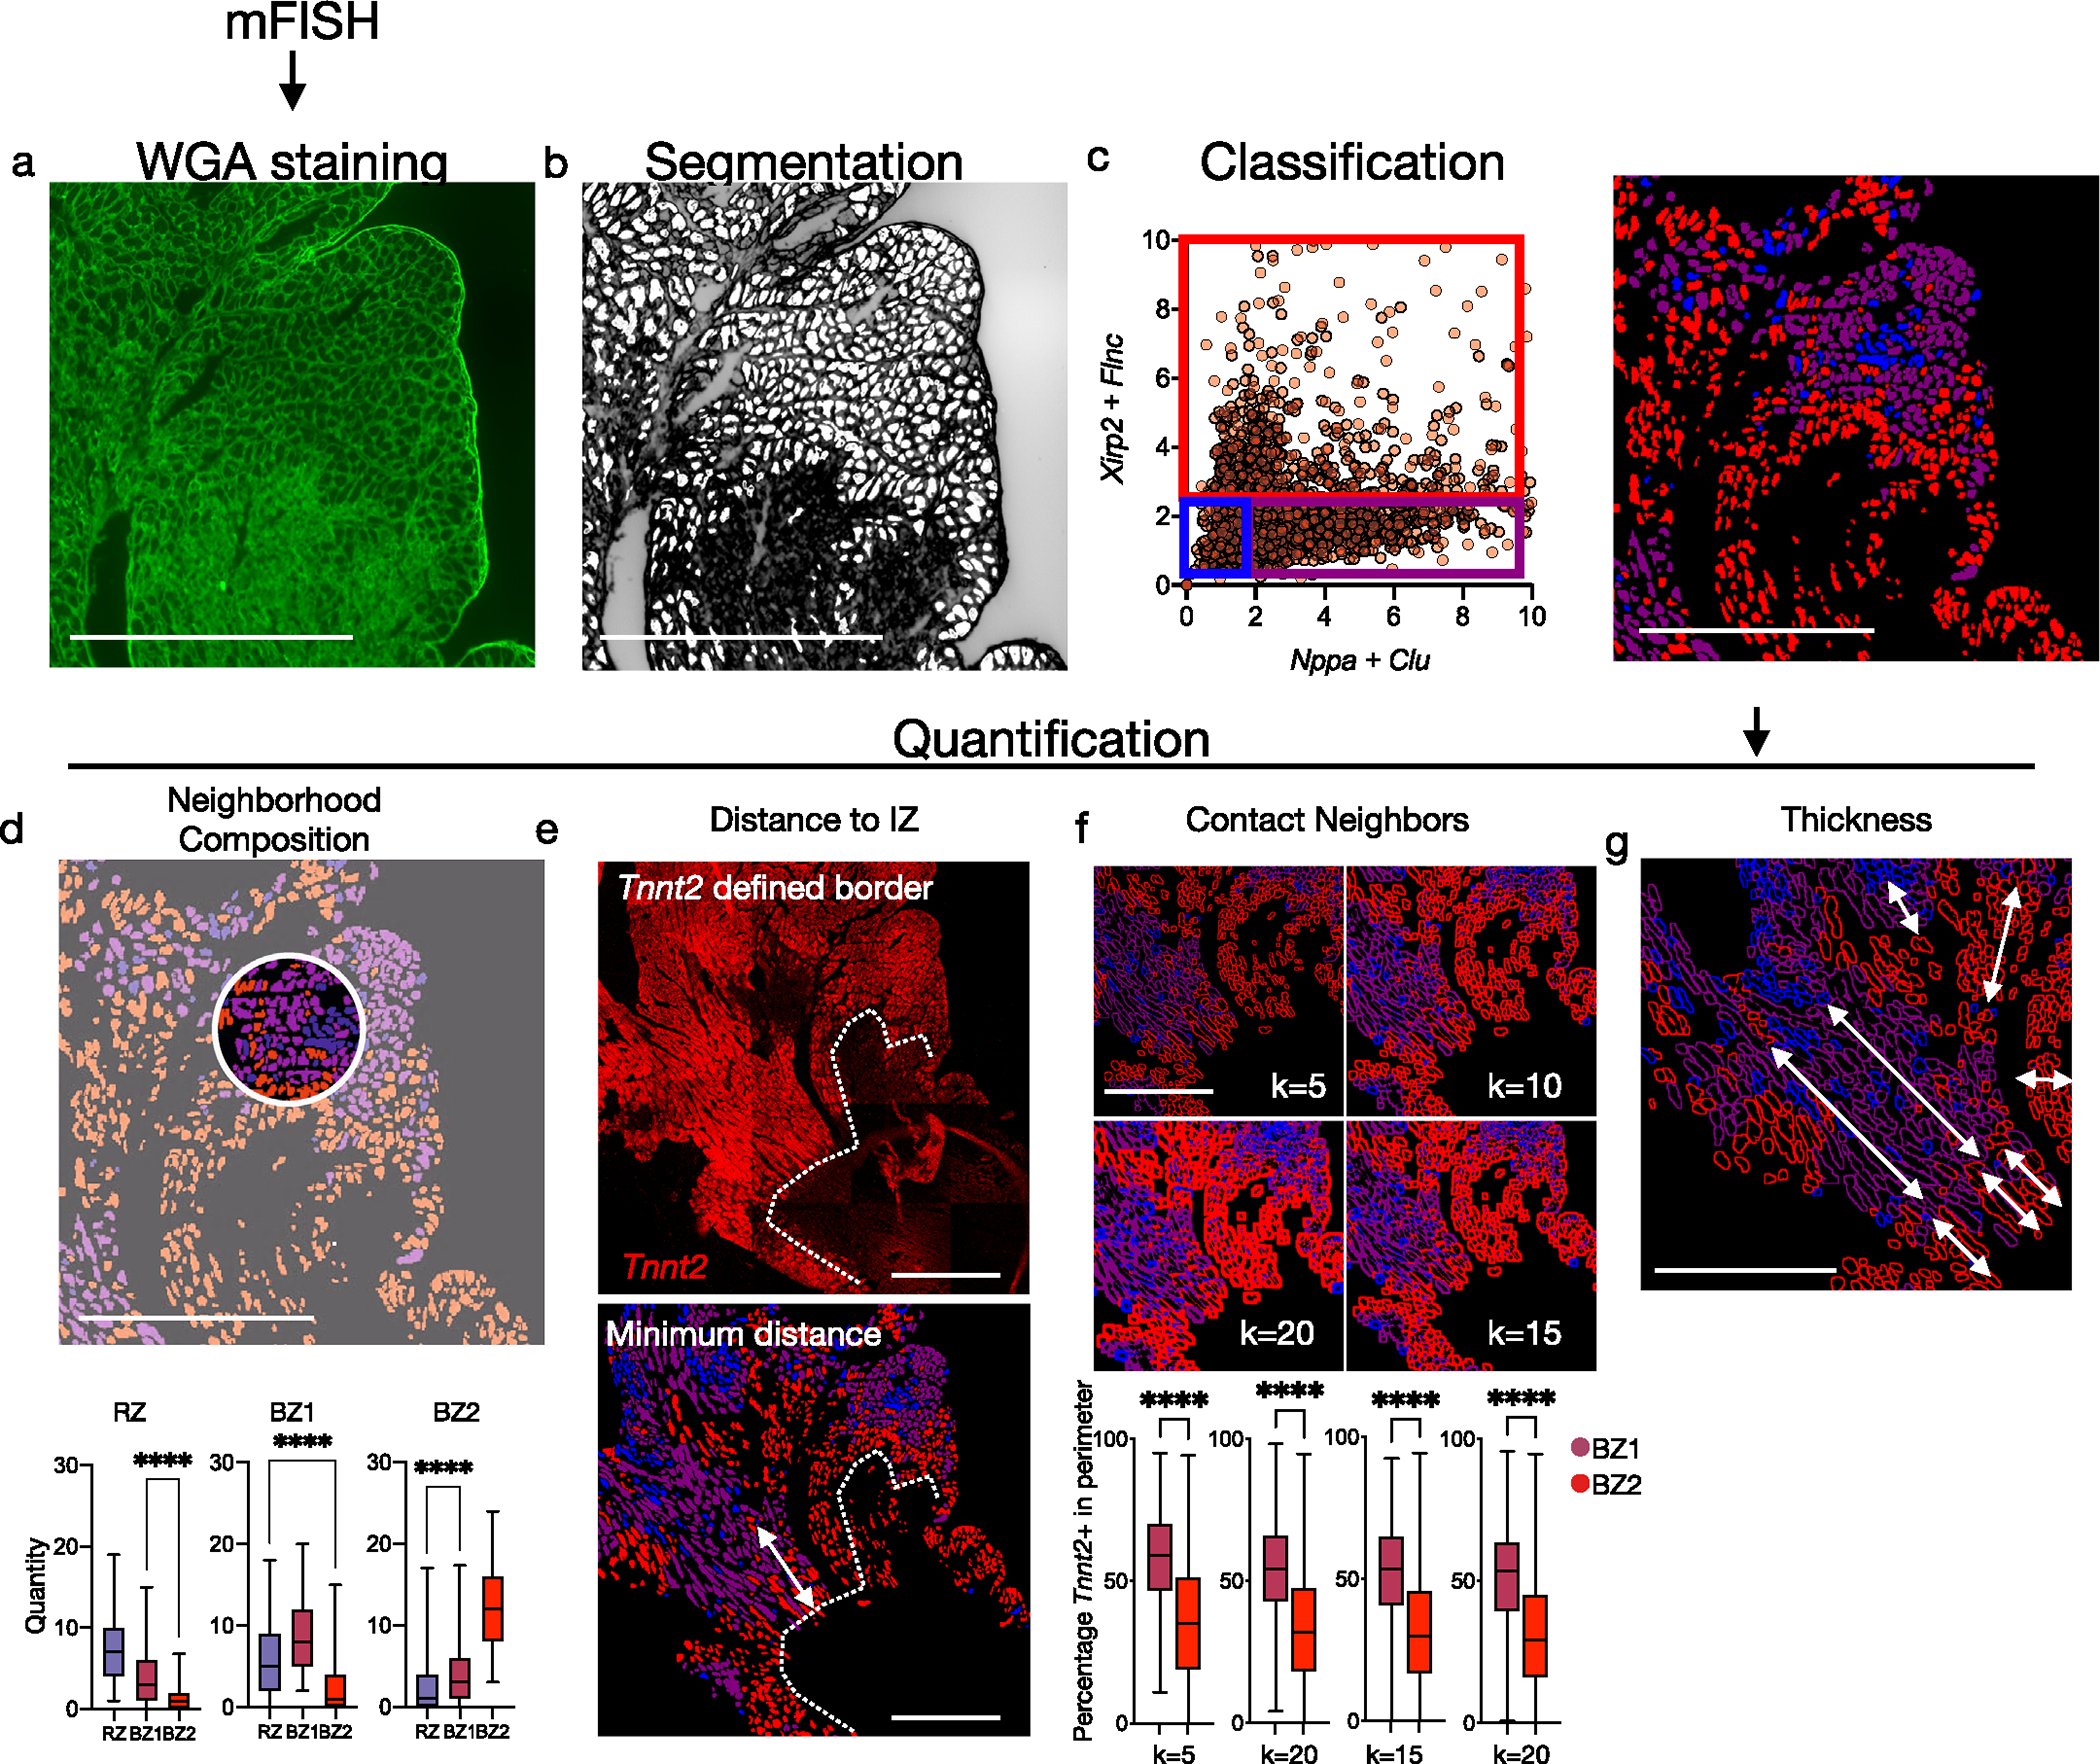
Extended Data Fig. 6 |. Segmentation, classification and quantification of mFISH data.

(a) After mFISH imaging, slides were stained for WGA to label the CM membrane. (b) Areas with well-defined perimeters were converted to regions-of-interest (shown in white). (c) Expression of BZ1 markers (Nppa, Clu) and BZ2 markers (Xirp2, Flnc) across ROIs. Scatter plot was visually inspected to establish thresholds and classify ROIs as RZ, BZ1, or BZ2 (blue, purple, red). (d) Quantification of neighbor composition in 25-pixel radius (n = 625 cells, and 1008 cells examined over 1 sample for BZ1 and BZ2, respectively). (e) Quantification of minimum distance to the IZ border defined by Tnnt2 staining. (f) To quantify direct contact of CMs, the percentage of Tnnt2 + pixels were calculated in ROI perimeters with various degrees of thickness (n = 625 cells, and 1008 cells examined over 1 sample for BZ1 and BZ2, respectively). (g) Contiguous regions of respective CM subsets were measured. Images shown are representative of 2 separate experiments. Scale bars indicate 500 μm. Boxplots presented with mean; box: 25th-75th%; whiskers: 2.5th-97.5th %. **** P-value < .0001; Mann-Whitney Test, two-sided.
