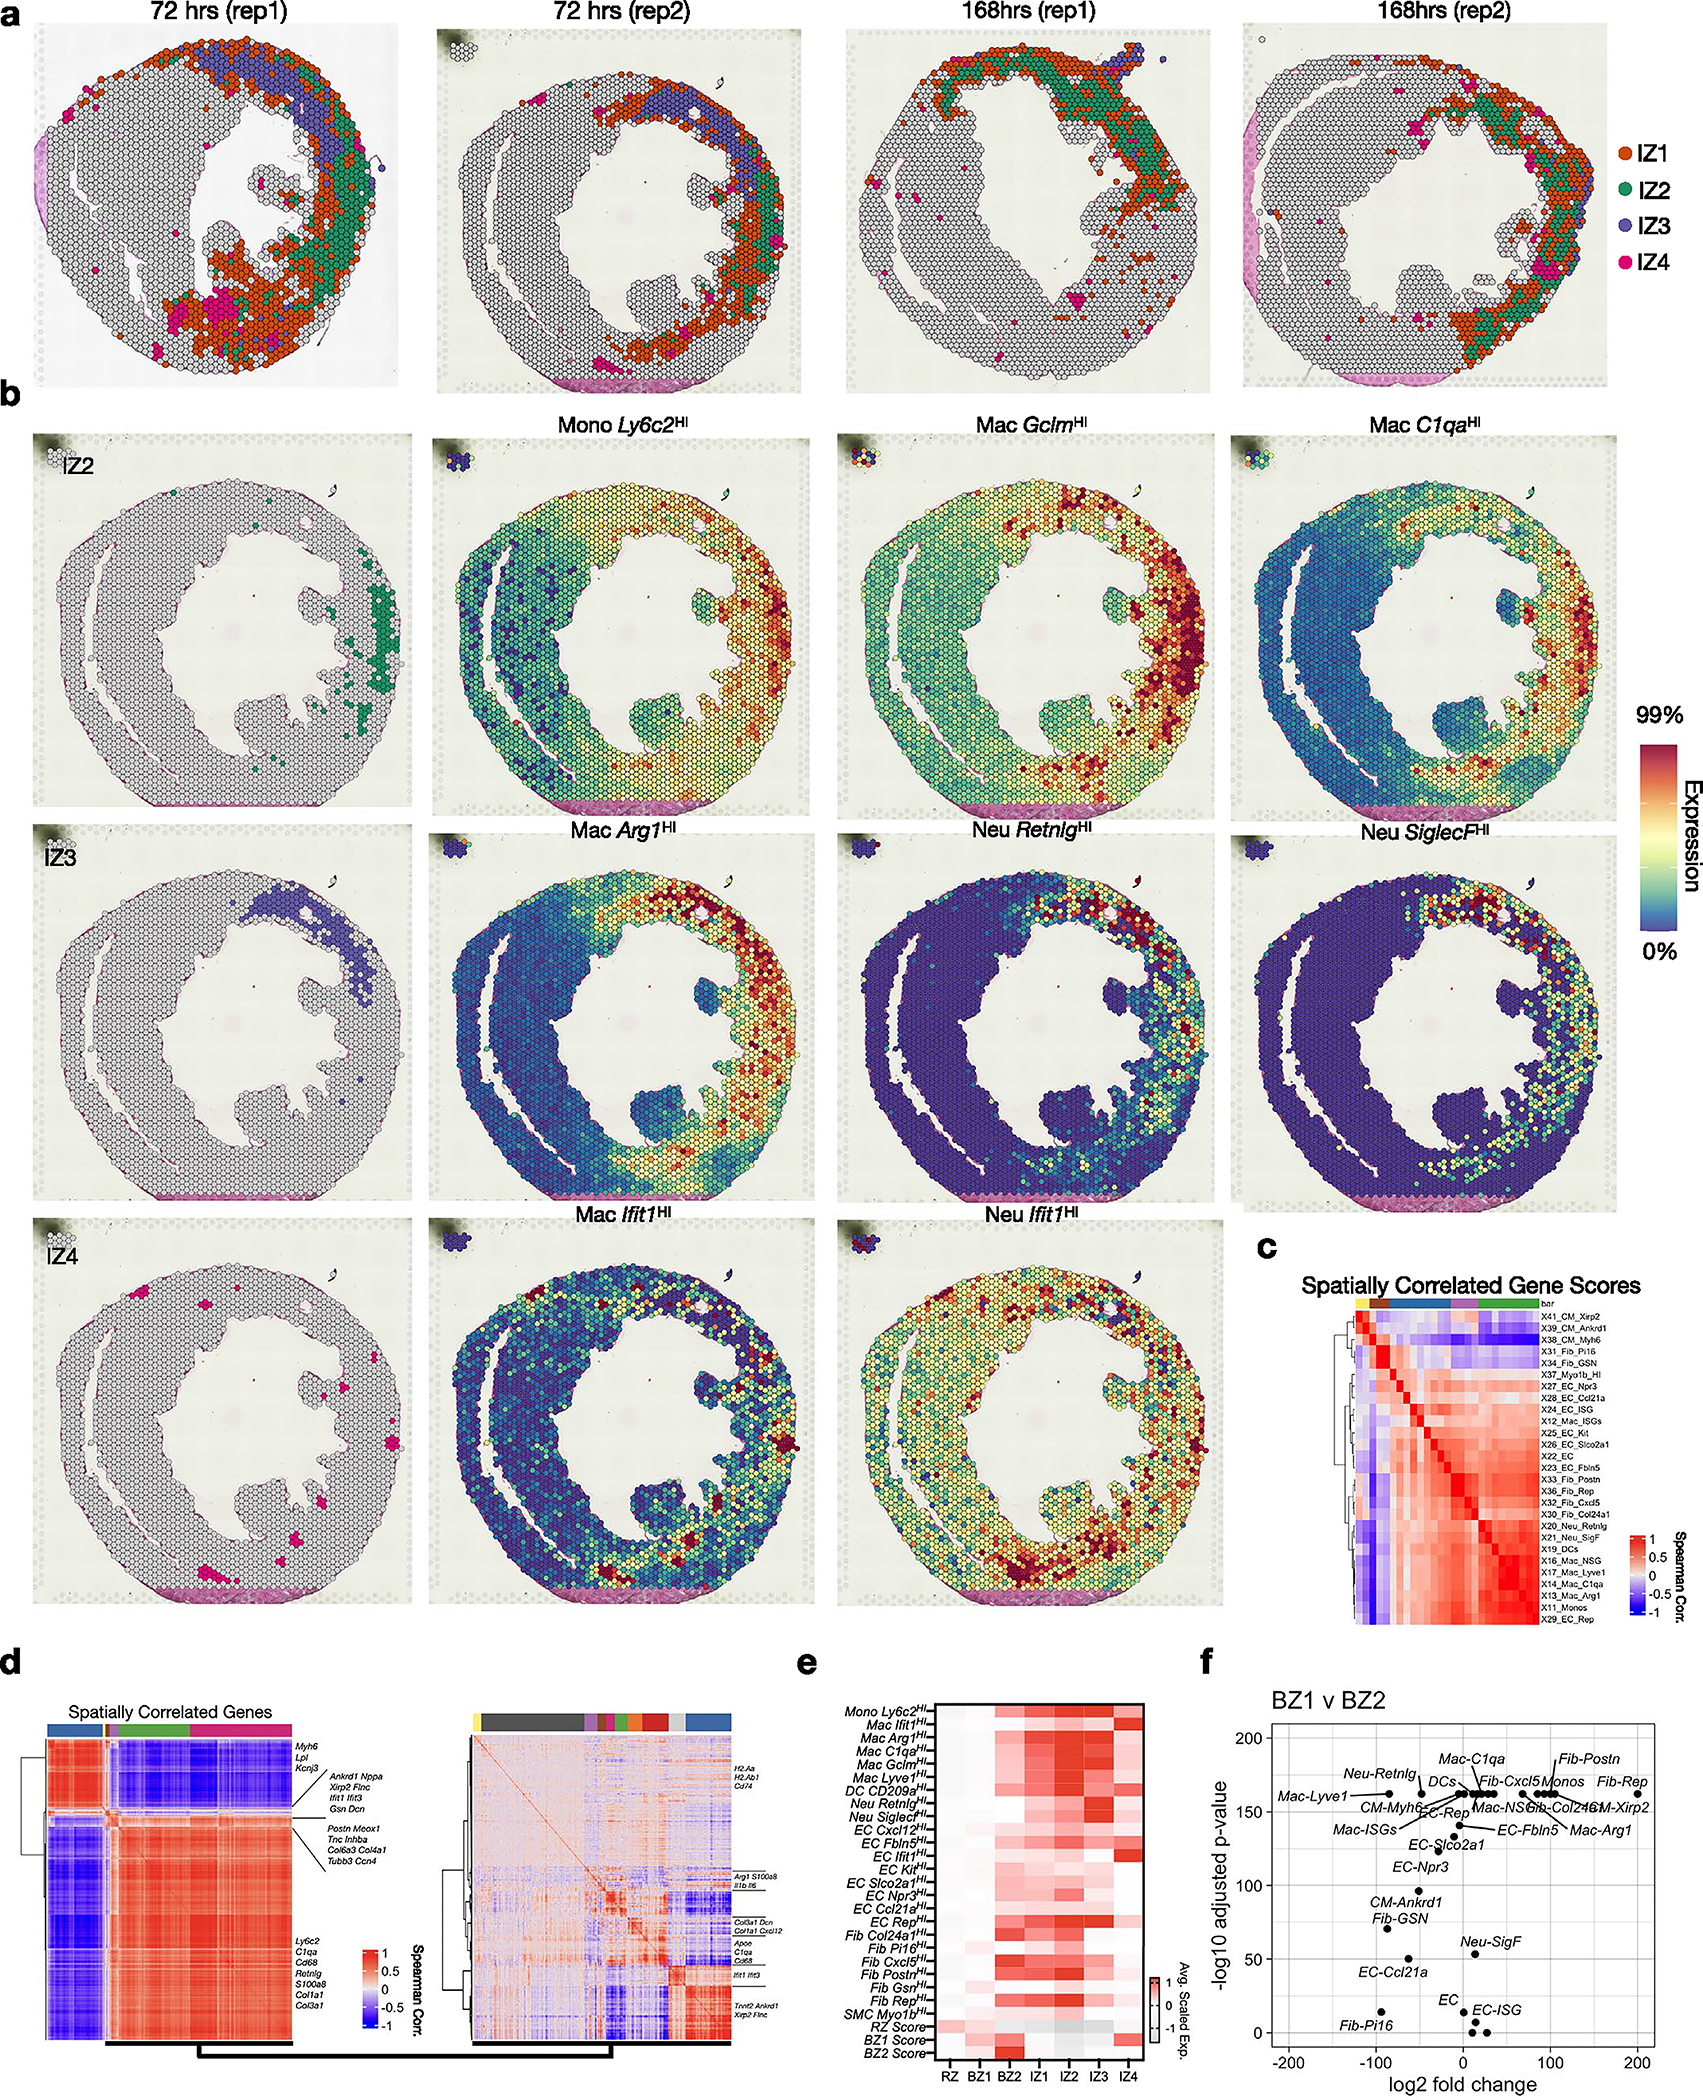
Extended Data Fig. 7 |. Colocalization of immune and fibroblast subsets across time.

(a) Spatial plots showing subclustering results (shown in 3c) across 72 hrs post-MI and 168 hrs post-MI replicates. (b) Colocalized immune subsets in 72 hrs post-MI replicate. (c) Spatially correlated and clustered gene-set scores. (d) Spatially correlated and clustered genes based on spearman rank correlation analysis for all regions (left) and infarct zone (right) of 72 hrs post-MI sample. (e) All gene-set scores projected to clusters. (f) Volcano plot comparing gene-set scores in BZ1 and BZ2 (Wilcoxon Ranked Sum Test, two-sided).
