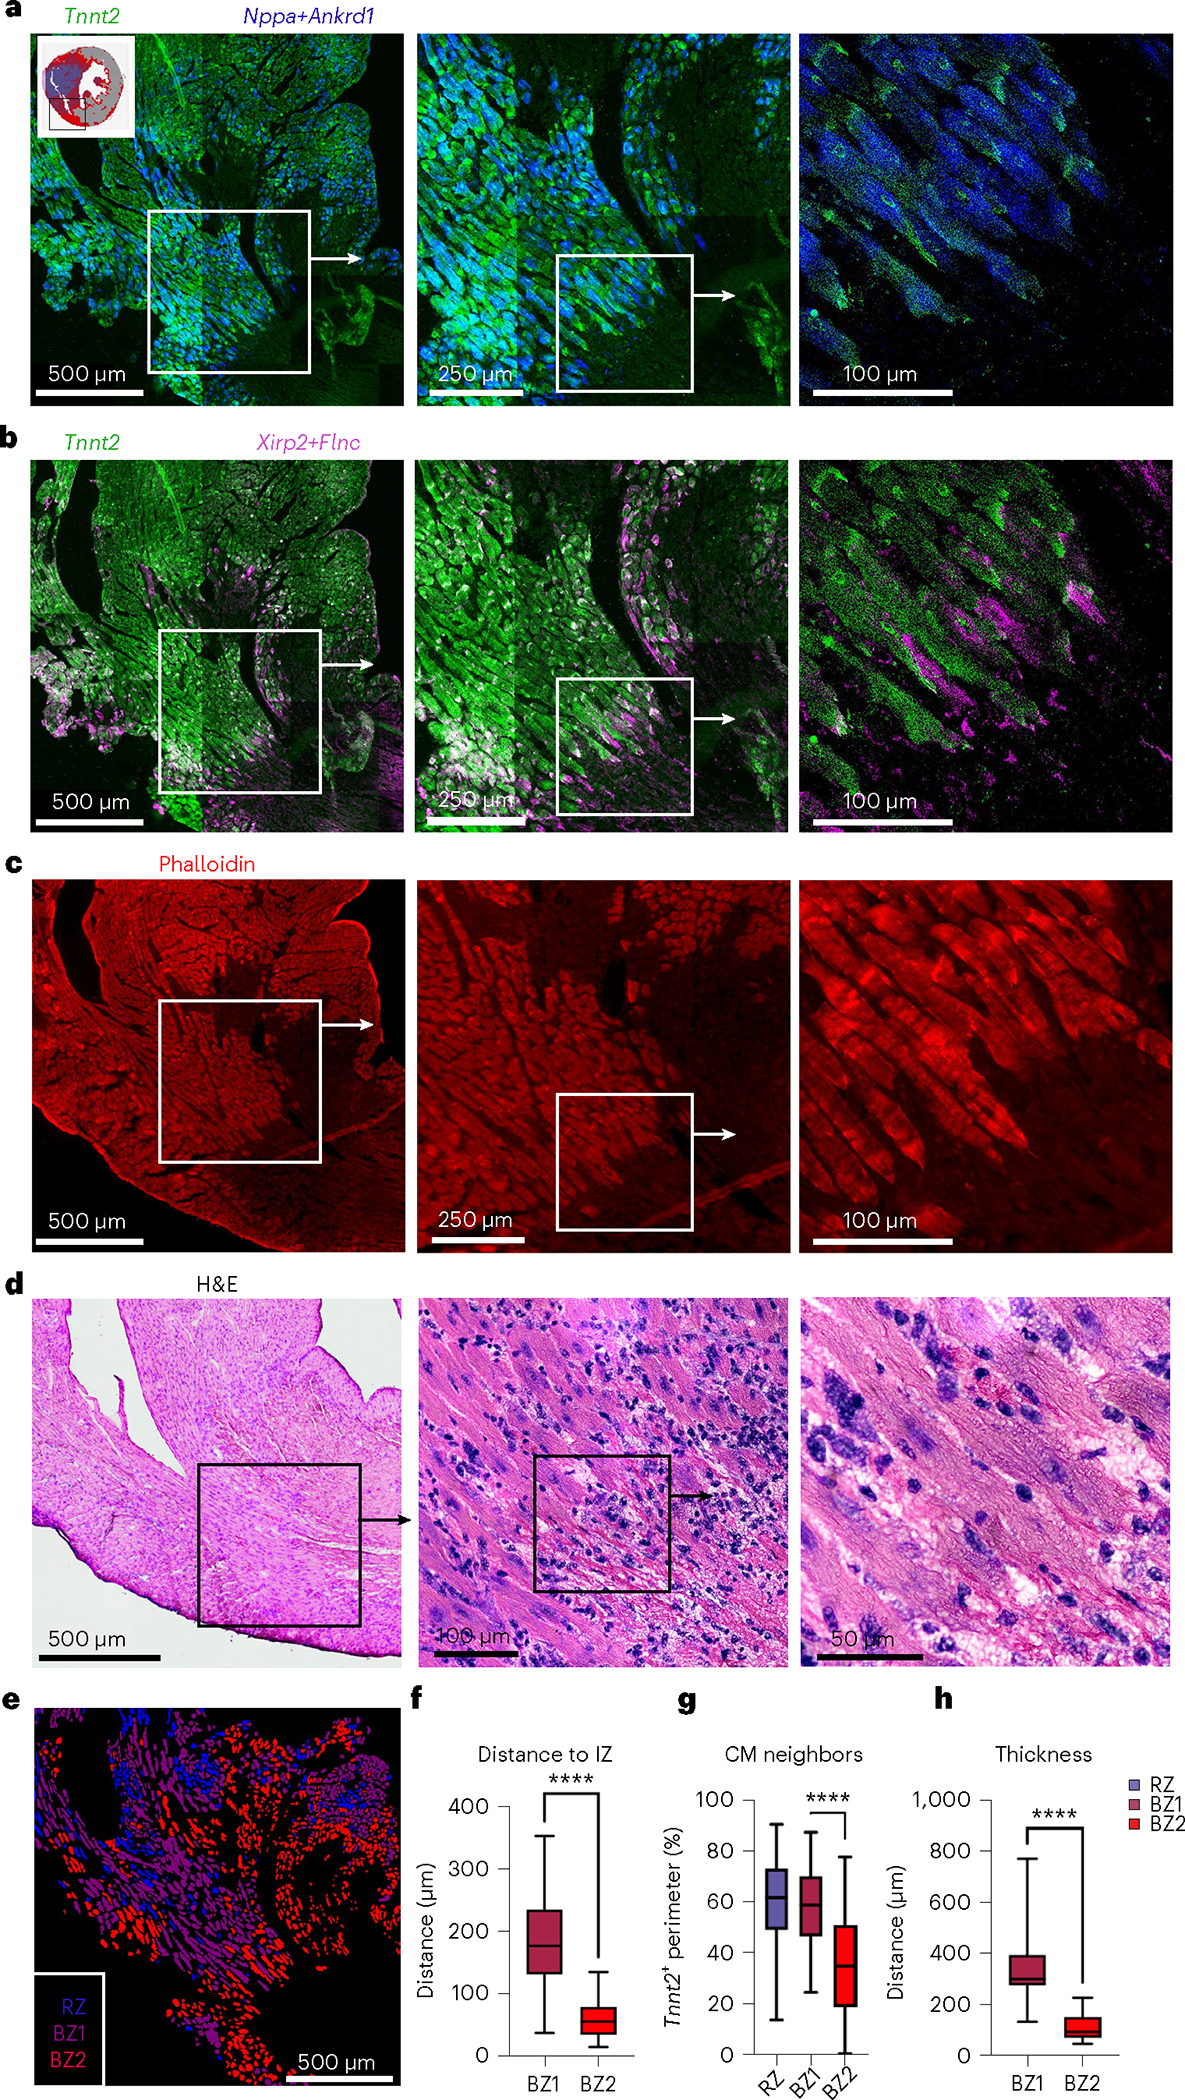
Fig. 2 |. BZ2 CMs form a thin boundary between surviving and ischemic myocardium.

a,b, Multiplex FISH images of serial section from Fig. 1f (inset shown). a, Green, RZ marker, Tnnt2; blue, BZ1 markers, Nppa and Ankrd1. b, Green, RZ marker, Tnnt2; magenta, BZ2 markers, Xirp2 and Flnc. c, Phalloidin-stained serial section. d, H&E images of serial section. e, CM classification based on WGA staining and multiplex FISH data for quantification in f,g (see Extended Data Fig. 4 for more details). f, Quantification of nearest distance to the IZ based on phalloidin-stained serial section. g, Quantification of contacting CM neighbors. f,g, Mean; box: 25th–75th percentile; whiskers: 2.5th–97.5th percentile; n = 438,625 and 1,008 cells examined over one sample for RZ, BZ1 and BZ2, respectively. h, Quantification of contiguous thickness. Multiplex FISH data are representative of two separate experiments. ****P < .0001, two-sided Mann–Whitney U-test.
