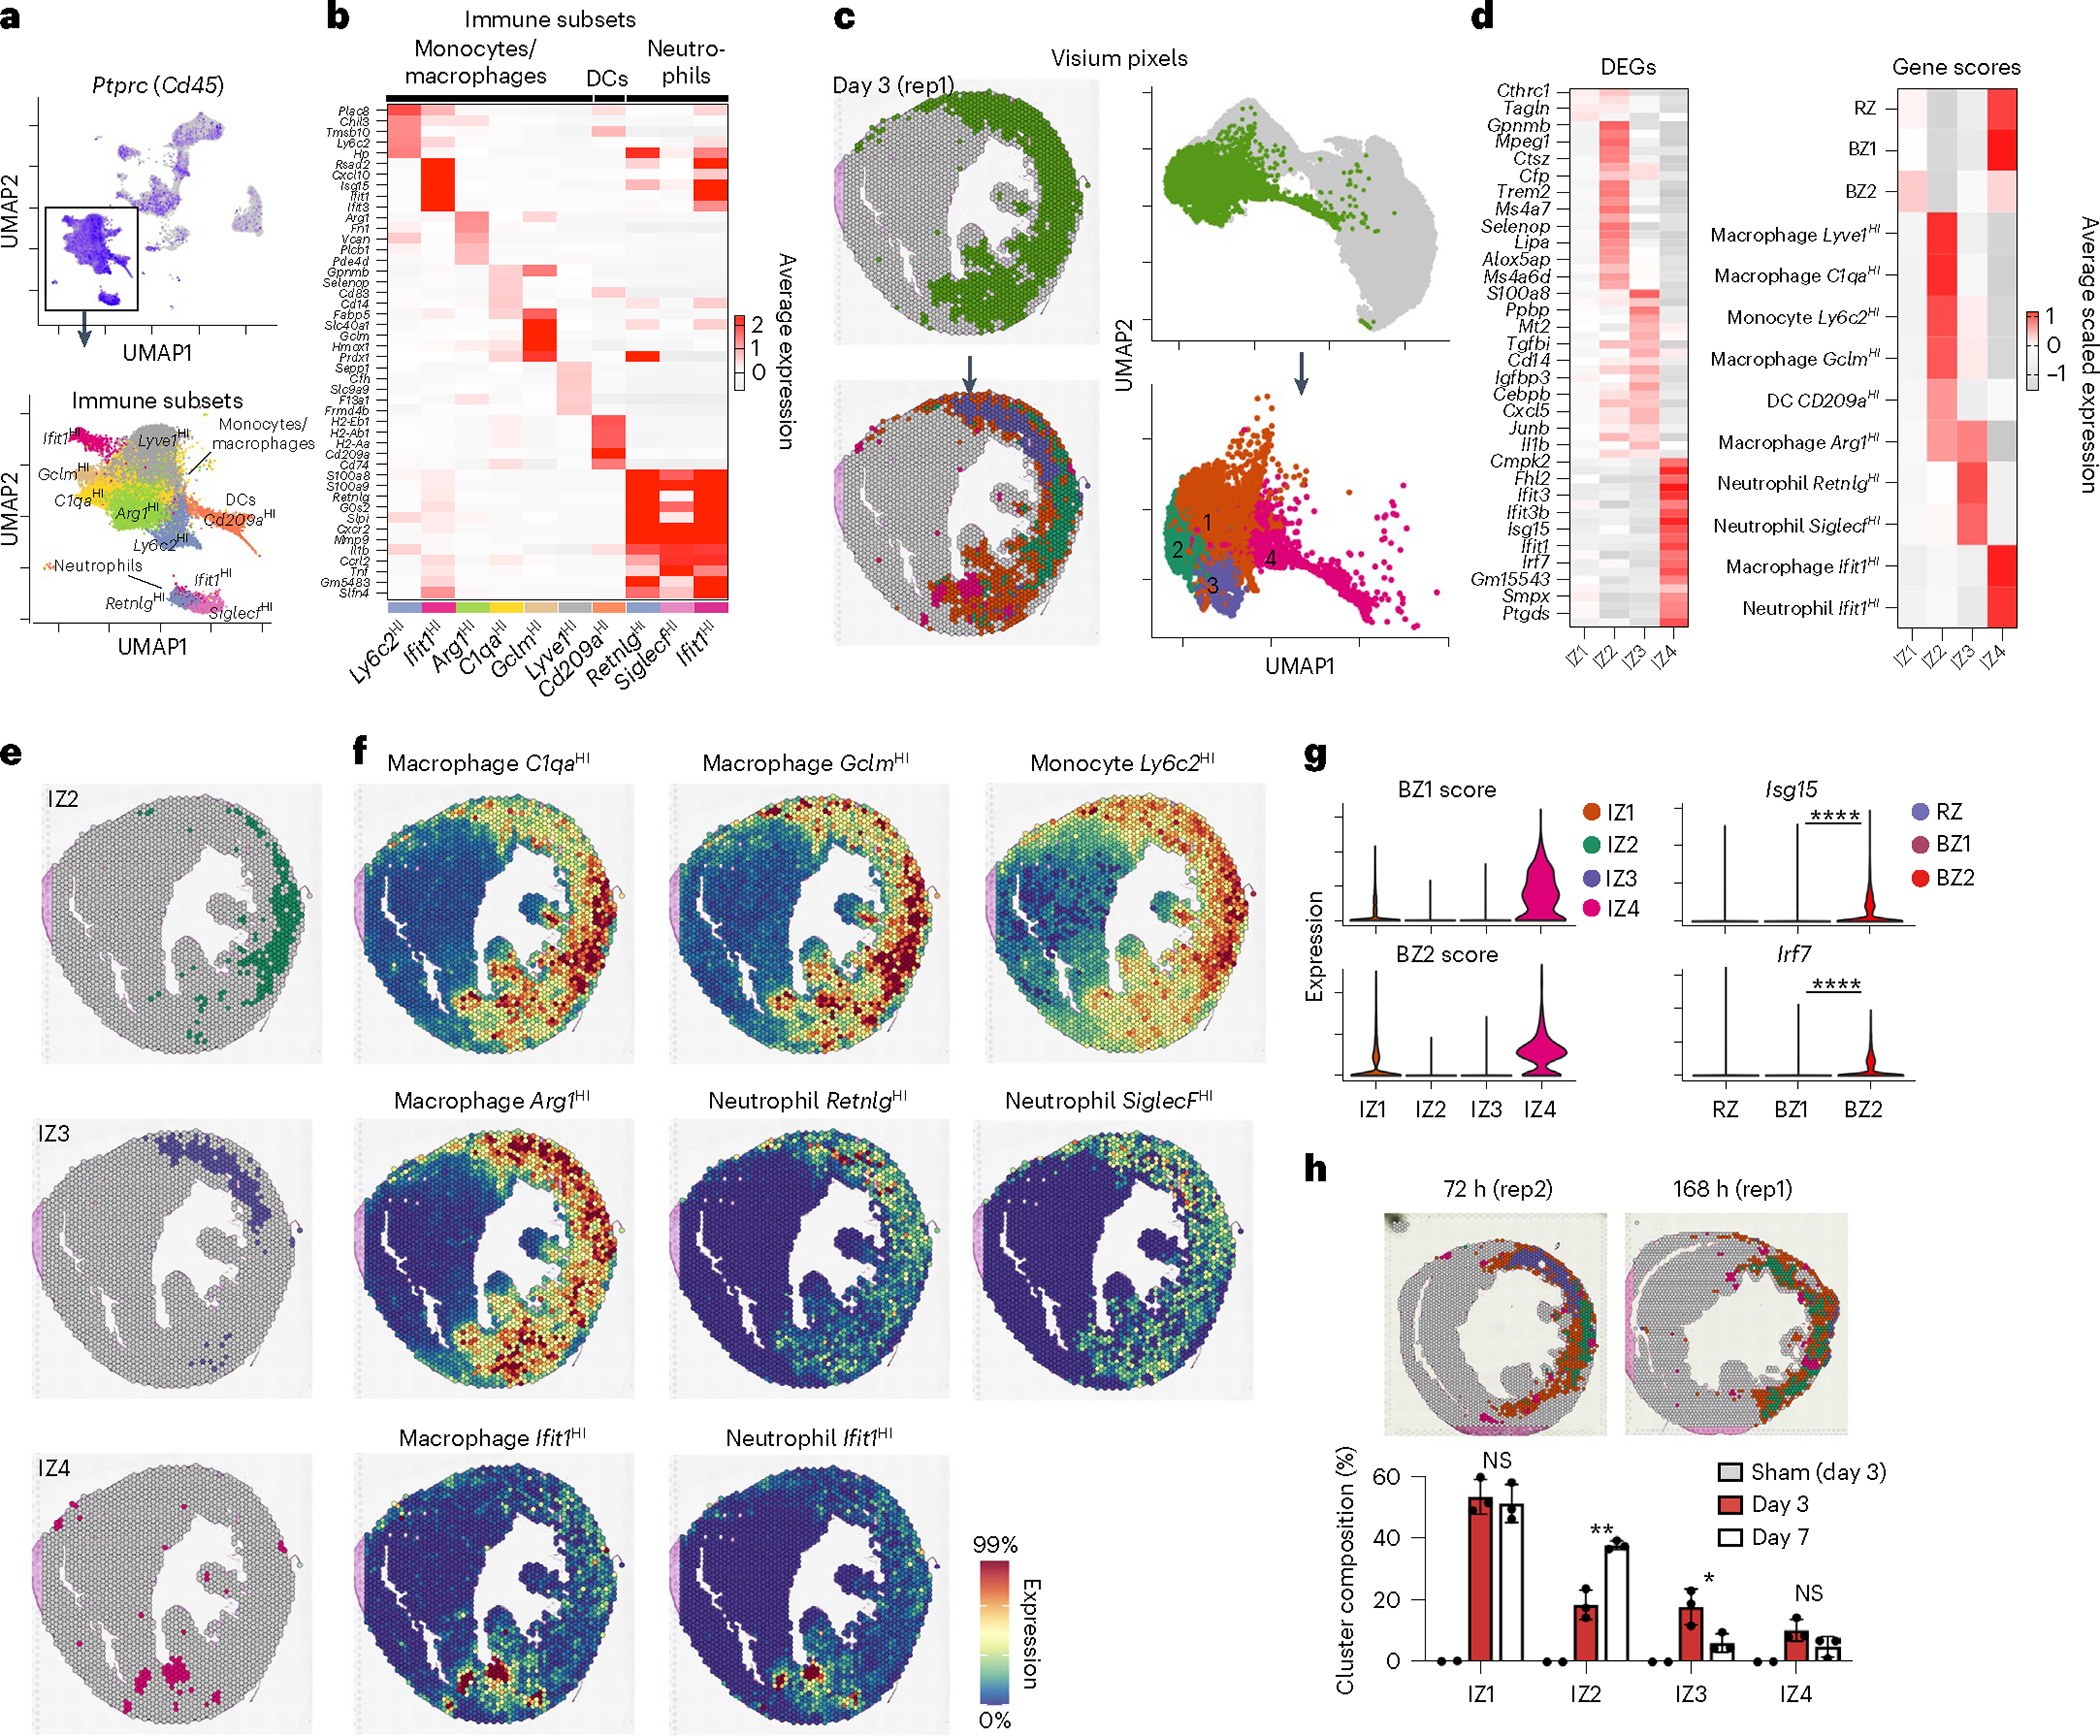
Fig. 3 |. Cardiac immune niches after ischemic injury.

a, Top, feature plot of Ptprc (Cd45) of integrated sc/snRNA-seq data (see Extended Data Fig. 1 for more detail). Bottom, subset and reclustered monocytes, macrophages and neutrophils. b, Heatmap of average, scaled expression of the cluster-defining DEGs in a. c, Clustering results of IZ spatial transcripts derived from integrated spatial dataset including sham (n = 2), 72 h (day 3) post-MI (n = 3) and 168 h (day 7) post-MI (n = 3) samples. Clusters are color-coded in space (left) and in UMAP plots (right) as part of the full dataset (top) and subset (bottom). d, Heatmap of cluster-defining DEGs (left) and gene-set scores (right). e,f, Spatial plots of cluster (e) with contributing genes scores (f) demonstrating colocalization of immune subpopulations. g, BZ1 and BZ2 scores applied to IZs (left) and select IFN-stimulated genes in CMs (right). h, Representative spatial plots (top) of clusters in 72 and 168 h post-MI samples with bar plots (bottom) quantifying the representation of each IZ across time/sample as the percentage of total IZ pixels (IZ2, P = 002578; IZ3, P = 035219; data presented as mean values ± s.d.; n = 3 biologically independent samples). Rep, replicating. g, *P < 0.05, **P < 0.01, ****P < 0.0001; two-sided Mann–Whitney U-test. h, Unpaired Student’s t-test.
