
Fig. 4 |. Activated fibroblasts localize with BZ2 CMs.
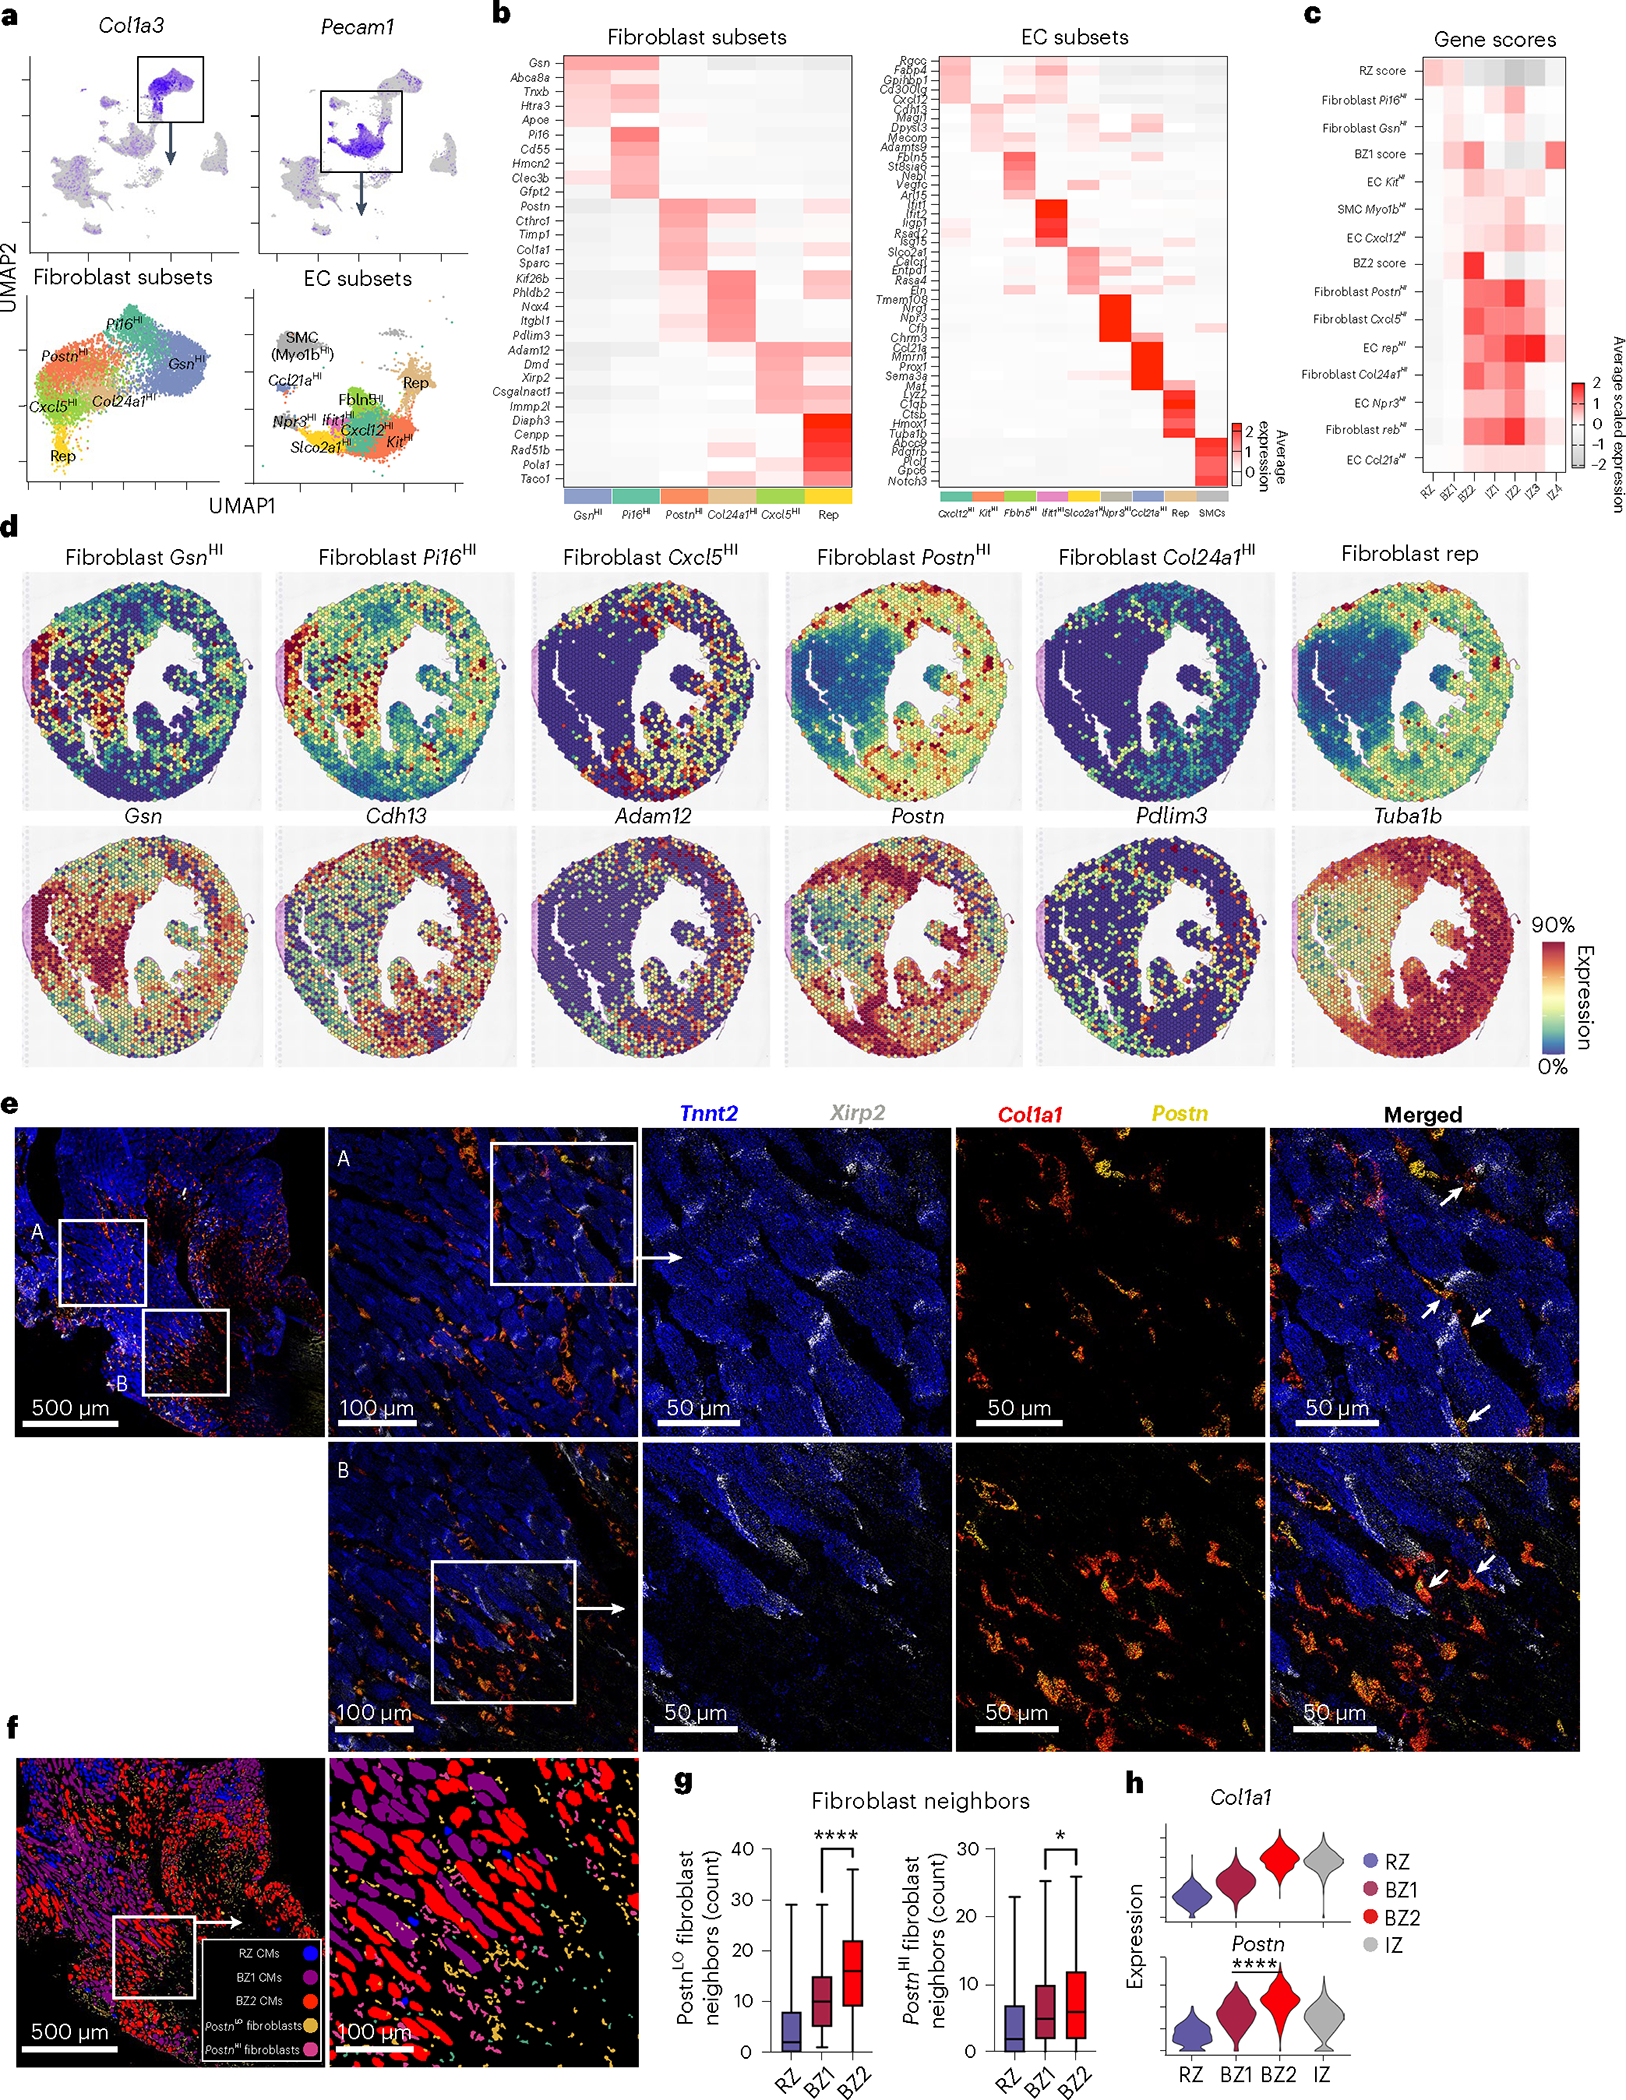
a, Top, feature plots of fibroblast (Col1a3) and EC (Pecam1) markers. Bottom, UMAP plots of fibroblast and EC subsets with marker genes overlayed. b, Heatmaps of cluster-defining DEGs from a. c, Heatmap of sn/scRNA-seq-derived gene-set scores (scaled for visualization) applied to previously defined BZs and IZs. d, Spatial feature plots with genes scores shown above and representative genes shown below. e, Multiplex FISH images of BZ (blue, Tnnt2; gray, Xirp2; red, Col1a1; yellow, Postn). f, Segmented and classified multiplex FISH data displaying CM and fibroblast subsets. g, Quantification of PostnHI/LO fibroblasts surrounding CM subsets (P = 0.0366, PostnHI; mean; box: 25th–75th percentile; whiskers: 2.5th–97.5th percentile; n = 438, 625 and 1,008 cells examined over one sample for RZ, BZ1 and BZ2, respectively). h, Violin plots of activated fibroblast markers applied to barcode-based spatial transcriptomic data. Multiplex FISH data are representative of two separate experiments. *P < 0.05, ****P < 0.0001. g, Unpaired Student’s t-test. h, Two-sided Mann–Whitney U-test.