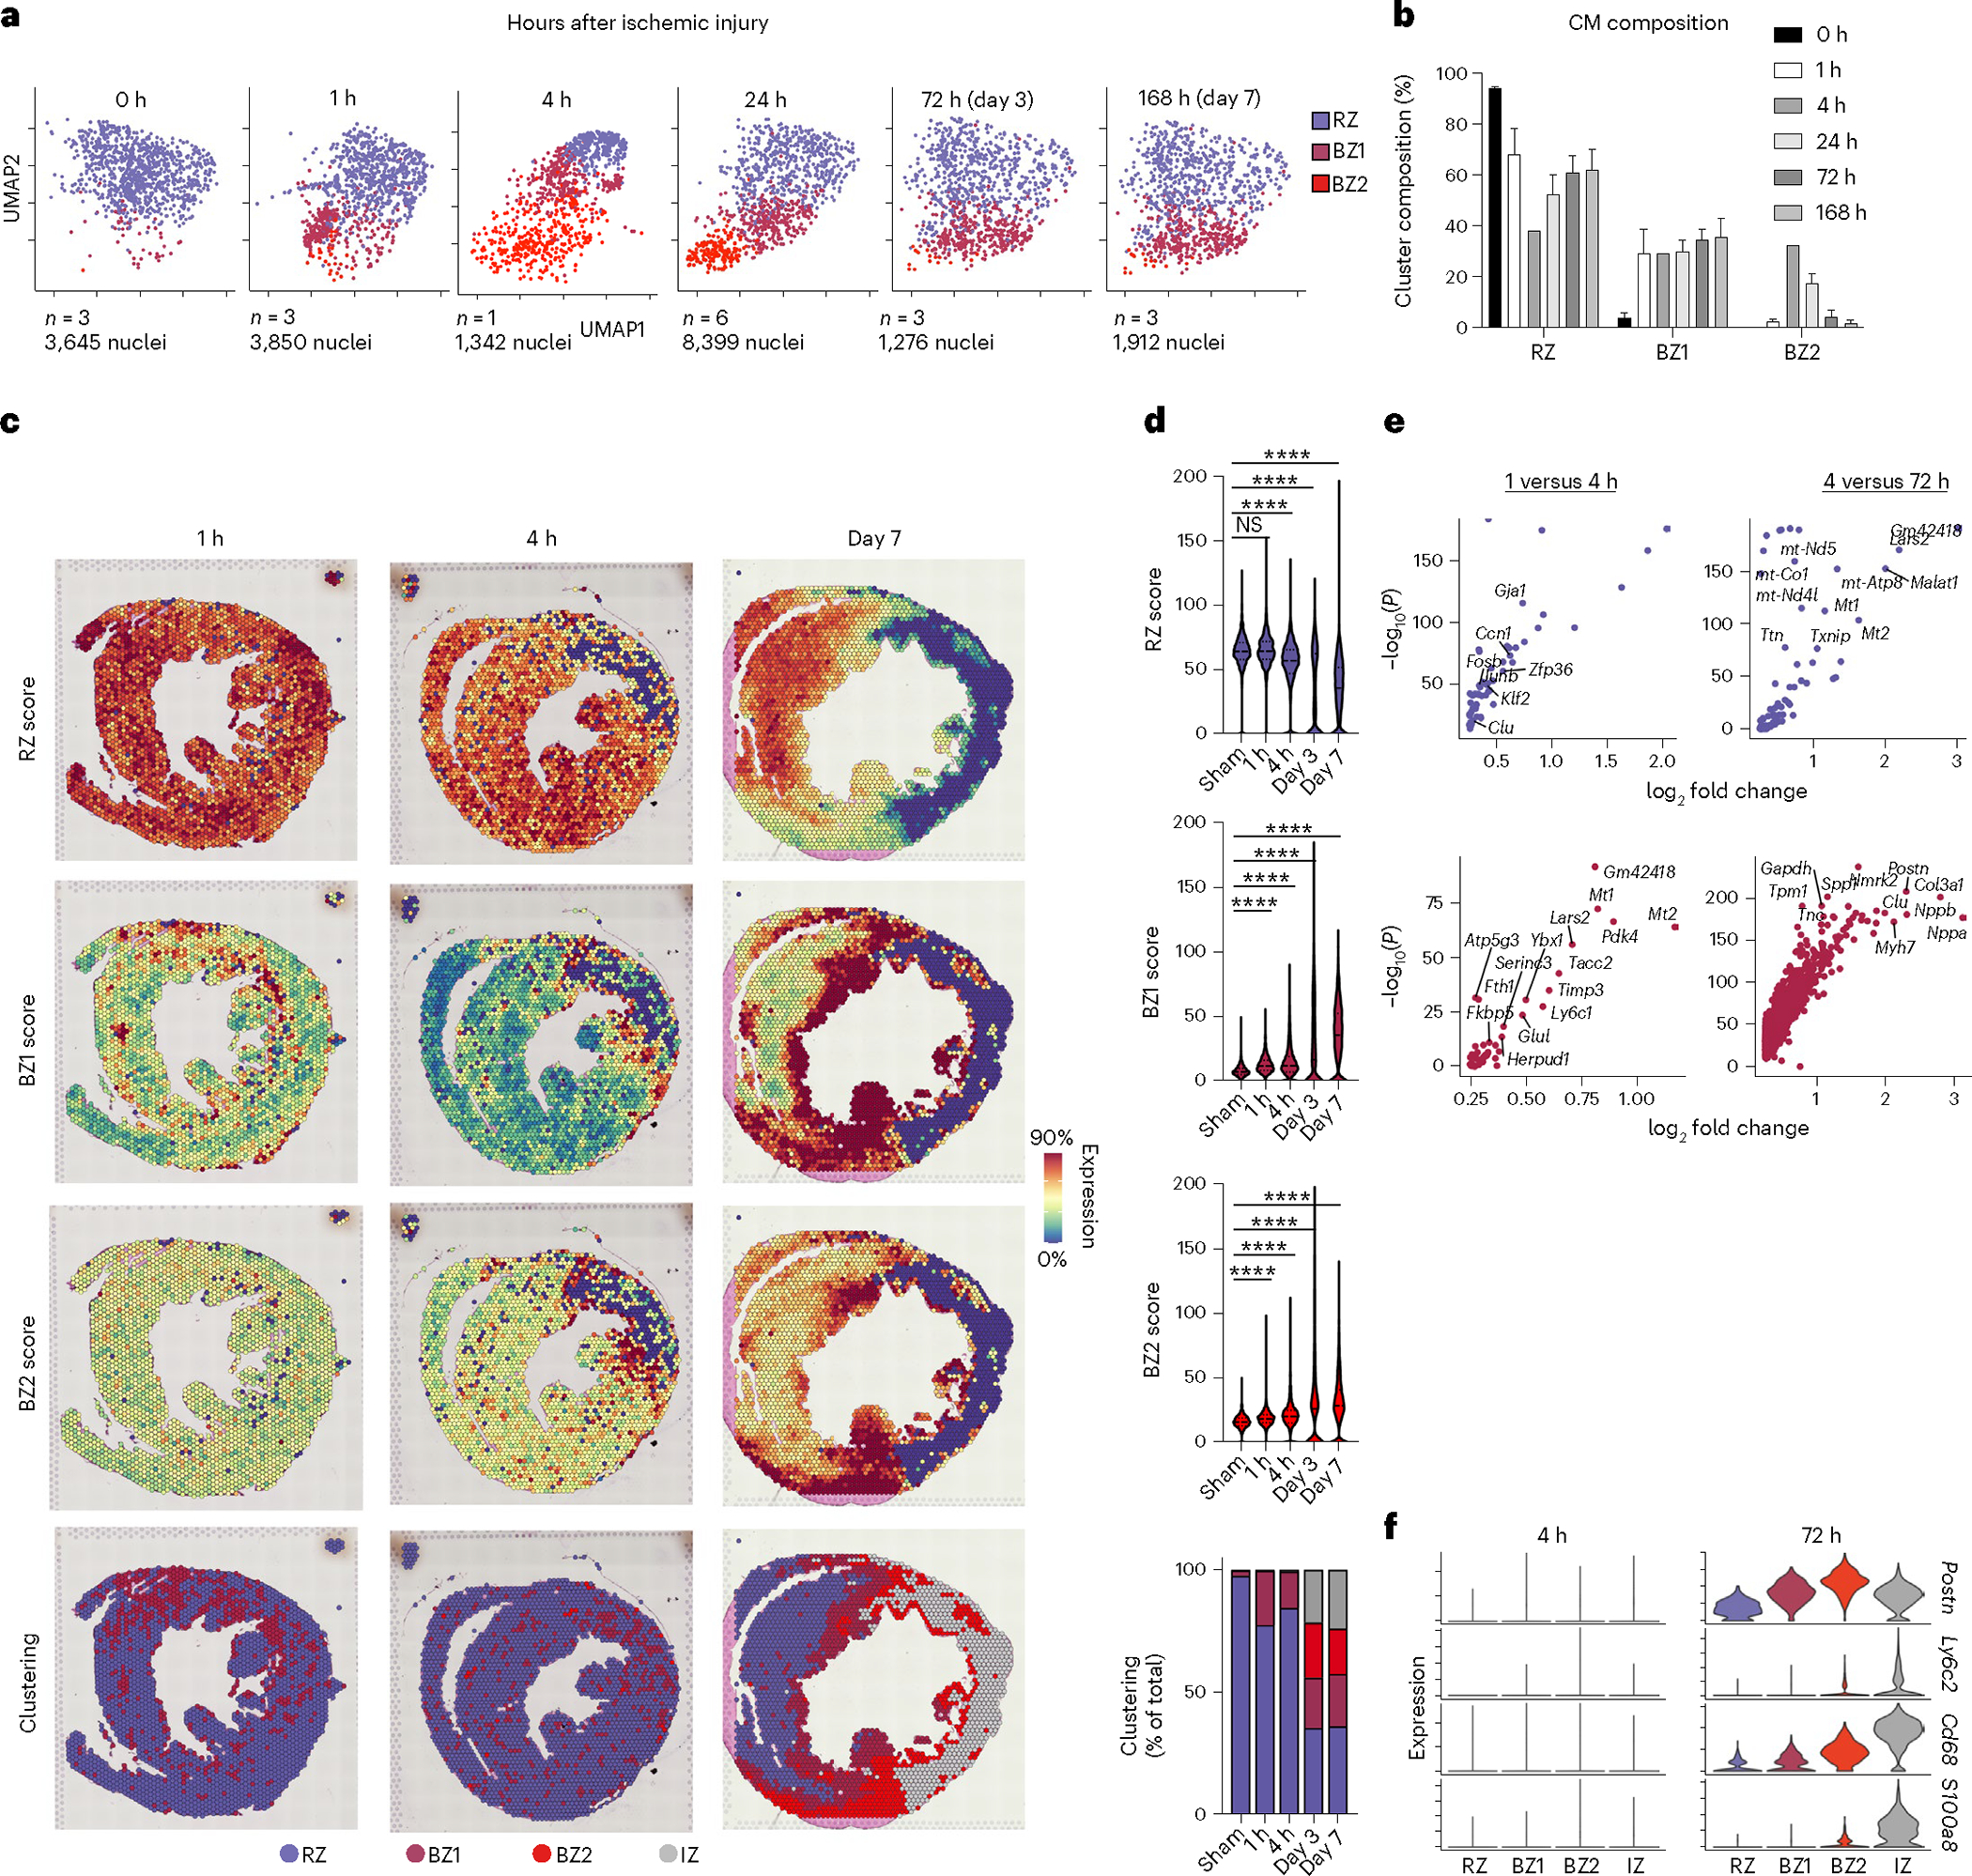
Fig. 5 |. The transcriptional BZ emerges rapidly after ischemia.

a, UMAP plots of integrated CMs split by time after ischemic injury. b, Cluster composition (percentage of total CMs per sample) as a function of time post-injury (data presented as mean values ± s.e.m.; n = 3 biologically independent samples for 0, 1, 72 and 168 h post-MI; n = 1 and 6 biologically independent samples for 4 and 24 h post-MI, respectively). c, Spatial feature plots of RZ, BZ1 and BZ2 scores and clustering results cross-sections from mouse heart 1 h (left), 4 h (center) and 168 h (right) post-MI. Clustering results are based on an integrated spatial dataset. d, Violin plots of CM subset scores as shown in c (median and 25th–75th percentile demarcated with dashed lines). Bottom, cluster ownership as the percentage of total pixel capture. e, Volcano plots displaying upregulated genes between the indicated times across respective CM subsets (Bonferroni-adjusted P values). f, Fibroblast (Postn), monocyte (Ly6c2), macrophage (Cd68) and neutrophil (S100a8) markers at 4 and 72 h post-MI. d, ****P < 0.0001, two-sided Mann–Whitney U-test.
