
Fig. 6 |. Morphological features of the emerging BZ.
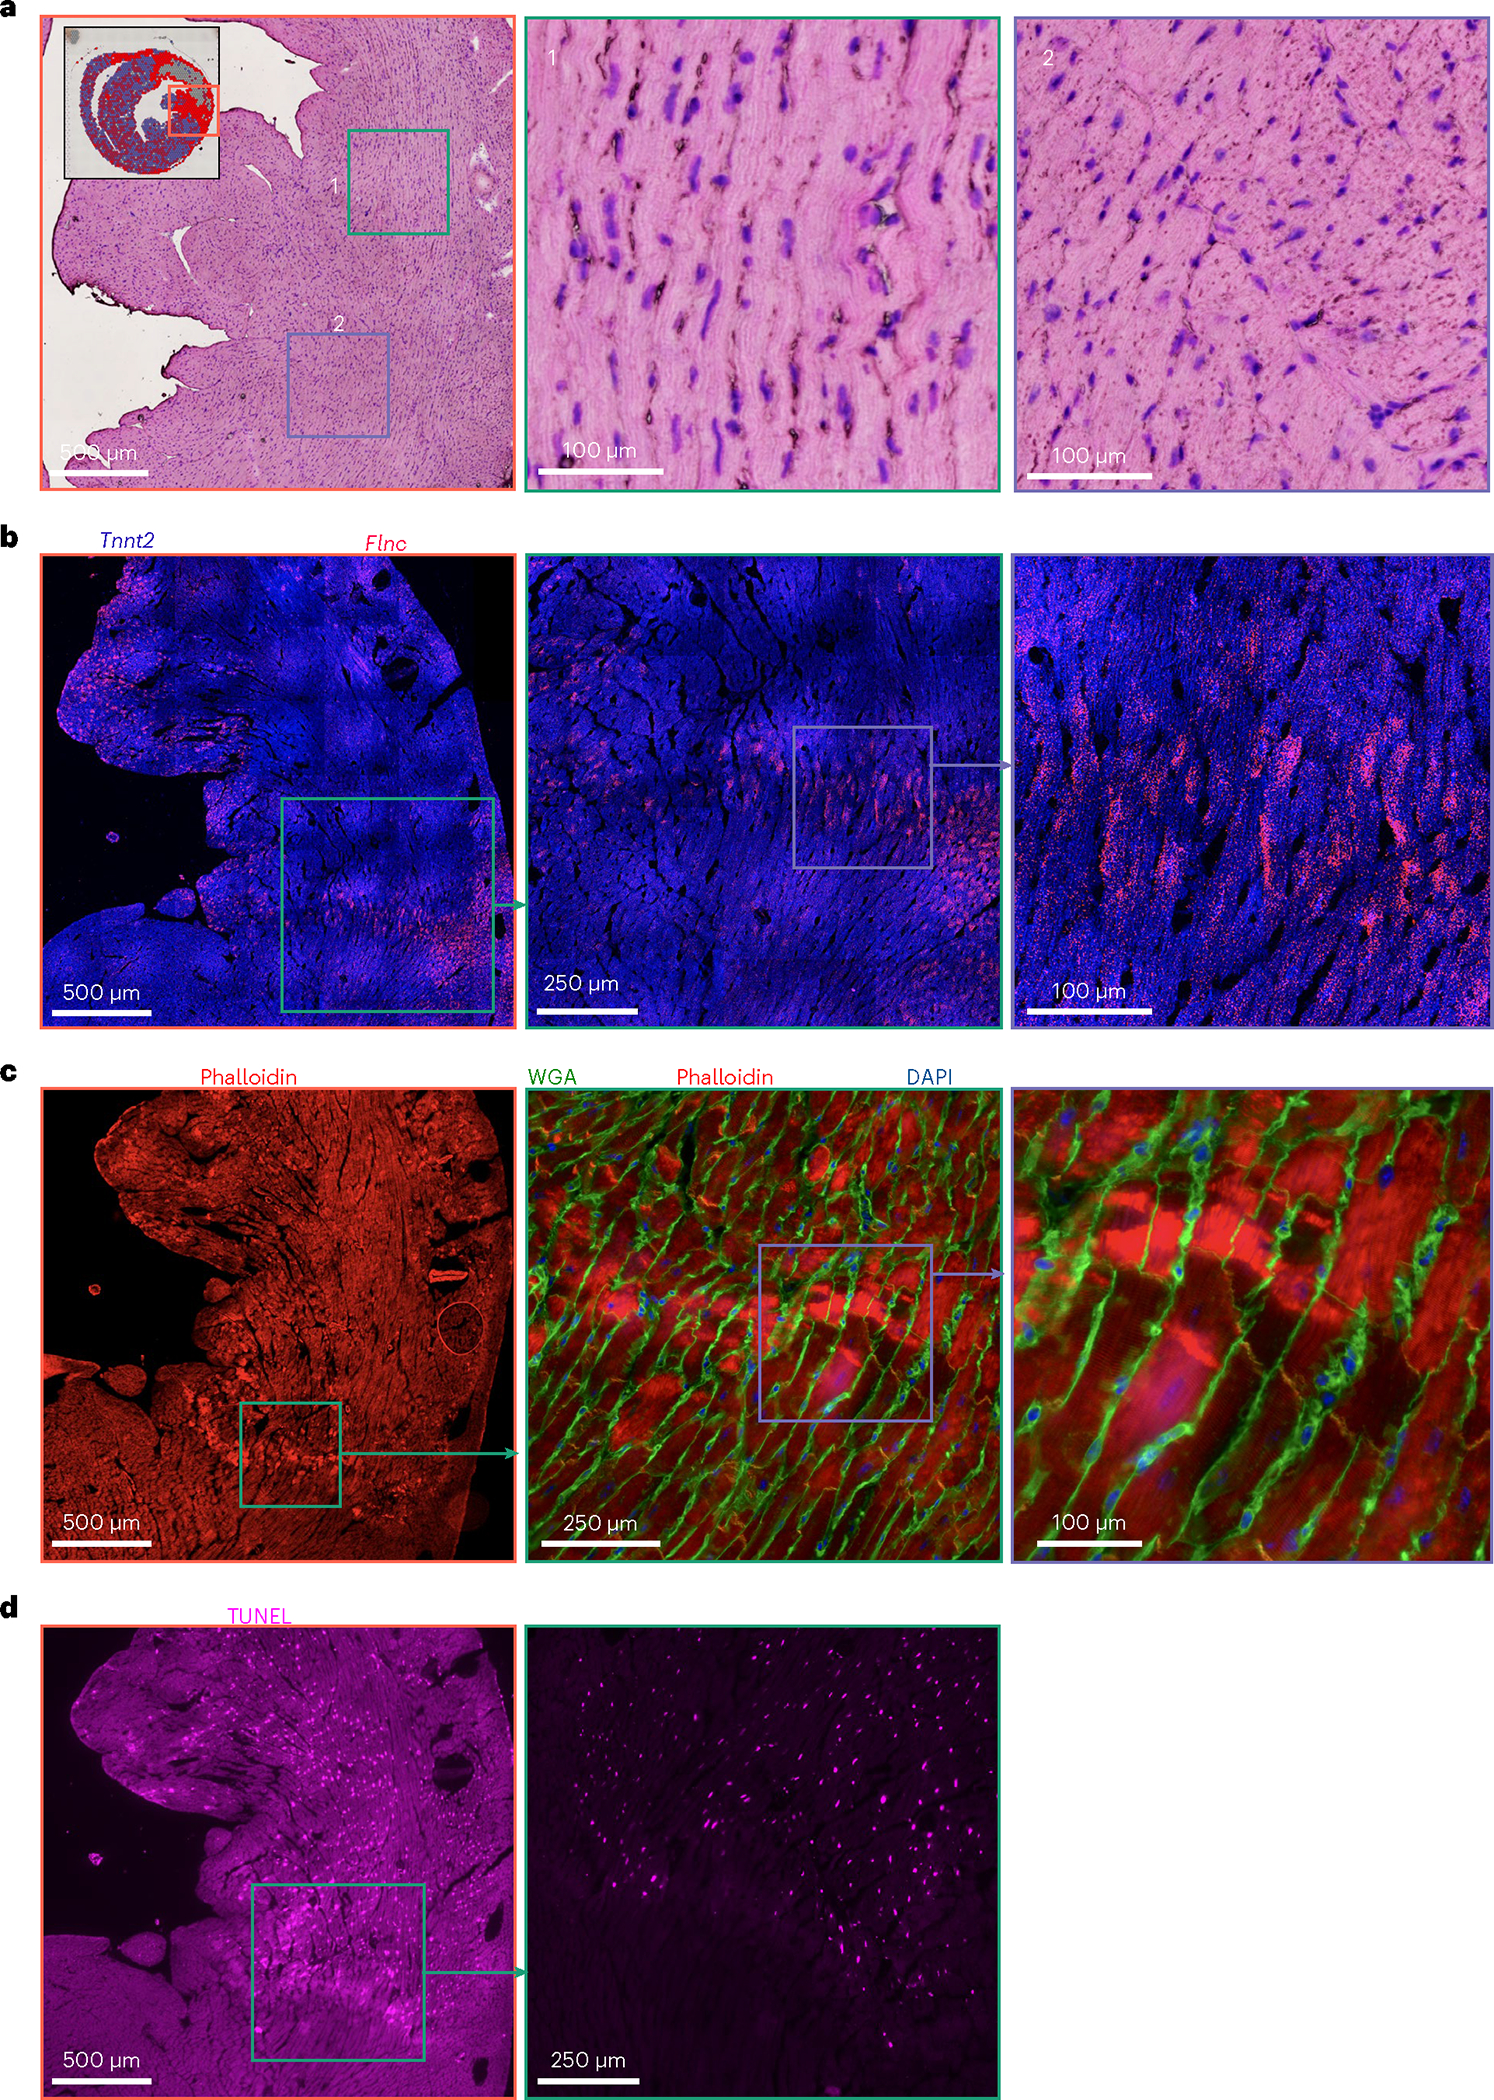
a, H&E-stained serial section of the 4 h post-MI sample shown in Fig. 5c (inset). b, FISH image showing Tnnt2 (blue) and the BZ2 marker gene, Flnc (red). c, Phalloidin (red), WGA (green) and DAPI (blue) staining of the consecutive serial section shown in b. d, TUNEL staining of consecutive serial section shown in c. Multiplex FISH data and images are representative of two separate experiments.